DESIGNED AND DEVELOPED BY ME
WaterCache
WaterCache
WaterCache
(03)
(03)
WaterCache
(03)
Company & Role
Master's thesis in Interaction Design
Design
Supervisor
Marcello Zanetta
Jules Toulemonde
Abstract
WaterCache is a systemic solution that supports people in having more direct access to virtual water information and allows them to be educated and guided towards reducing their water consumption. It has the ambitious goal of steering a highly consumerist society toward a community change and more sustainable habits, incentivizing people and businesses to be involved in the water-free ecosystem.
Project Description
WaterCache is a systemic solution that supports people in having more direct access to virtual water information and allows them to be educated and guided towards reducing their water consumption. It has the ambitious goal of steering a highly consumerist society toward a community change and more sustainable habits, incentivizing people and businesses to be involved in the water-free ecosystem.
Context introduction
Context introduction
Context introduction
Context introduction
”According to a United Nations study, “Global water use has increased by a factor of six over the past 100 years and continues to grow steadily at a rate of about 1% per year. This study study concluded that the world could face a 40% global water deficit by 2030 under a business-as-usual scenario (2030 WRG, 2009).”
”According to a United Nations study, “Global water use has increased by a factor of six over the past 100 years and continues to grow steadily at a rate of about 1% per year. This study study concluded that the world could face a 40% global water deficit by 2030 under a business-as-usual scenario (2030 WRG, 2009).”
”According to a United Nations study, “Global water use has increased by a factor of six over the past 100 years and continues to grow steadily at a rate of about 1% per year. This study study concluded that the world could face a 40% global water deficit by 2030 under a business-as-usual scenario (2030 WRG, 2009).”
”According to a United Nations study, “Global water use has increased by a factor of six over the past 100 years and continues to grow steadily at a rate of about 1% per year. This study study concluded that the world could face a 40% global water deficit by 2030 under a business-as-usual scenario (2030 WRG, 2009).”


Desktop research
Desktop research
Desktop research
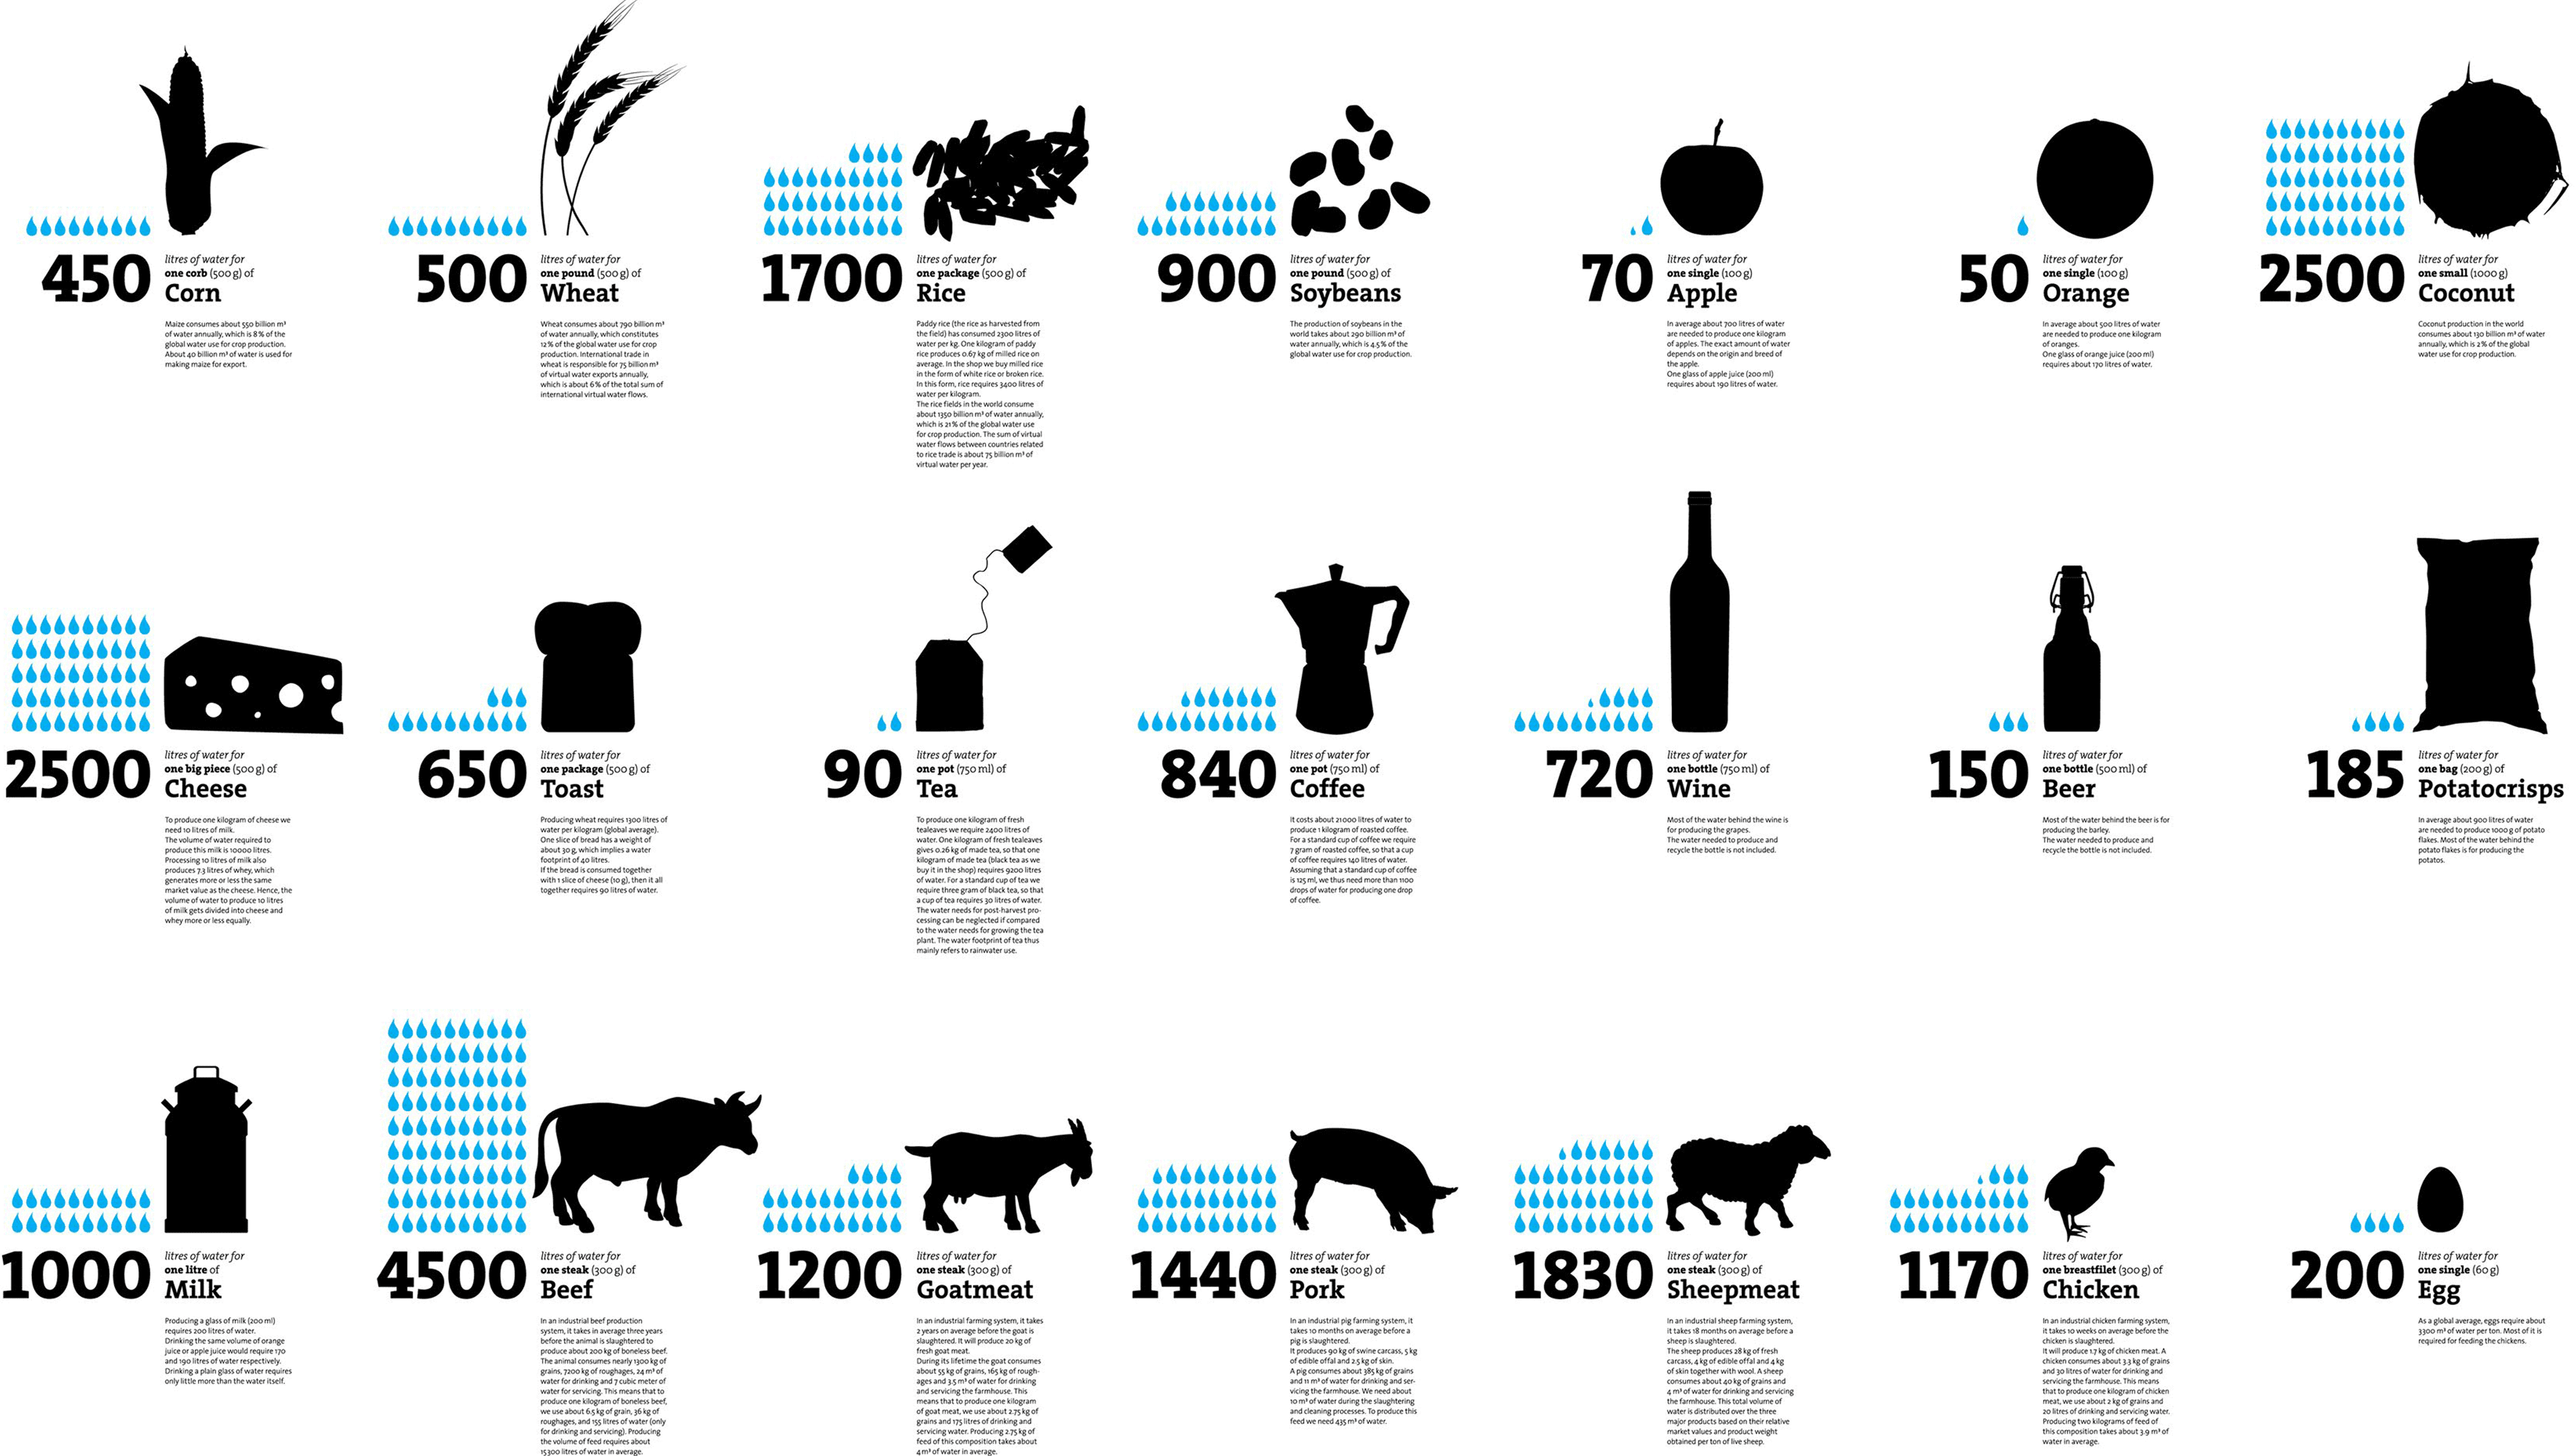
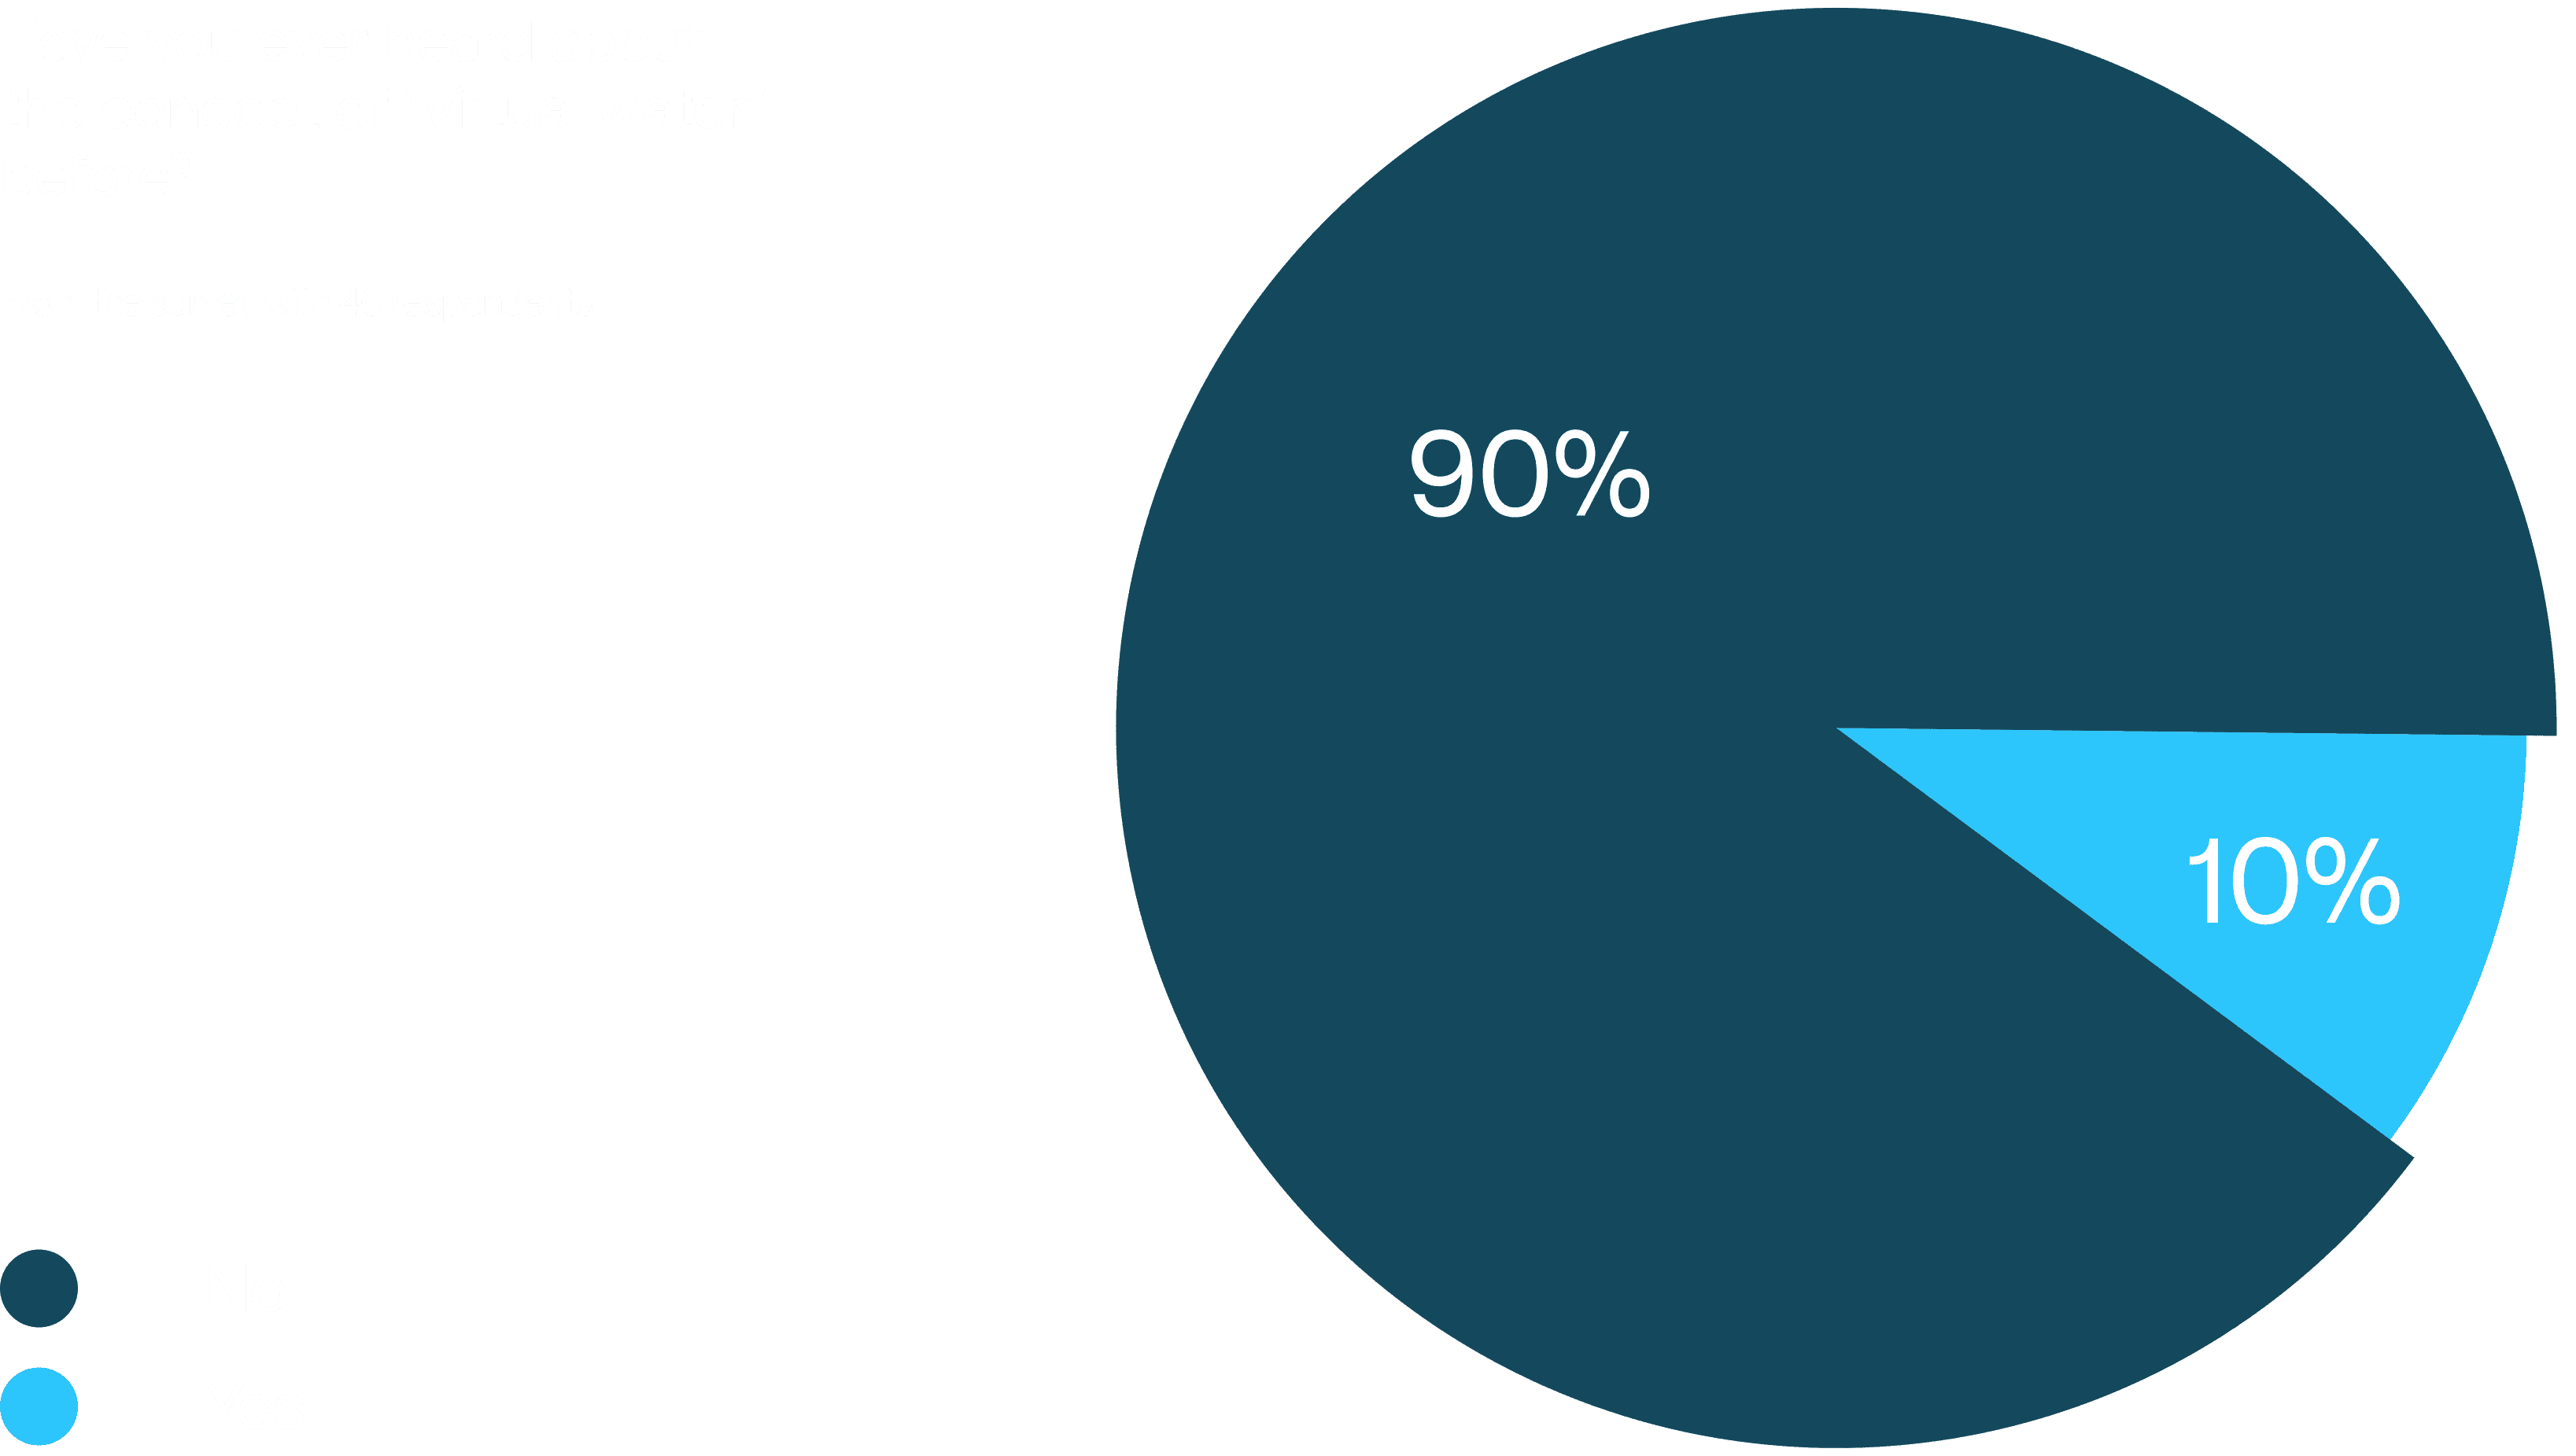
The desktop research highlights the growing global water crisis, predicting a 40% supply deficit by 2030. It distinguishes between direct water use (household consumption) and indirect (virtual water in products), emphasizing public unawareness. Agriculture is the largest consumer (70%), followed by industry (20%) and municipalities (10%). Case studies, such as Cape Town’s "Water Wise" campaign and Italy’s Acea Group initiatives, showcase efforts to reduce water waste. However, the research identifies a gap in consumer awareness and access to water footprint data, stressing the need for systemic and digital solutions.
The desktop research highlights the growing global water crisis, predicting a 40% supply deficit by 2030. It distinguishes between direct water use (household consumption) and indirect (virtual water in products), emphasizing public unawareness. Agriculture is the largest consumer (70%), followed by industry (20%) and municipalities (10%). Case studies, such as Cape Town’s "Water Wise" campaign and Italy’s Acea Group initiatives, showcase efforts to reduce water waste. However, the research identifies a gap in consumer awareness and access to water footprint data, stressing the need for systemic and digital solutions.
User research
User research
User research
The user research investigated people's perceptions, knowledge, and behaviors regarding water consumption through surveys and interviews. Findings reveal that while people express concern about water scarcity, they primarily associate waste with direct household use, overlooking virtual water. A significant gap exists between perceived and actual consumption, with respondents vastly miscalculating their usage. Although there is a willingness to adopt sustainable habits, a lack of incentives and clear information leads to inaction. The research highlights the need for tools that provide real-time data and encourage behavioral change through education and rewards.
The user research investigated people's perceptions, knowledge, and behaviors regarding water consumption through surveys and interviews. Findings reveal that while people express concern about water scarcity, they primarily associate waste with direct household use, overlooking virtual water. A significant gap exists between perceived and actual consumption, with respondents vastly miscalculating their usage. Although there is a willingness to adopt sustainable habits, a lack of incentives and clear information leads to inaction. The research highlights the need for tools that provide real-time data and encourage behavioral change through education and rewards.
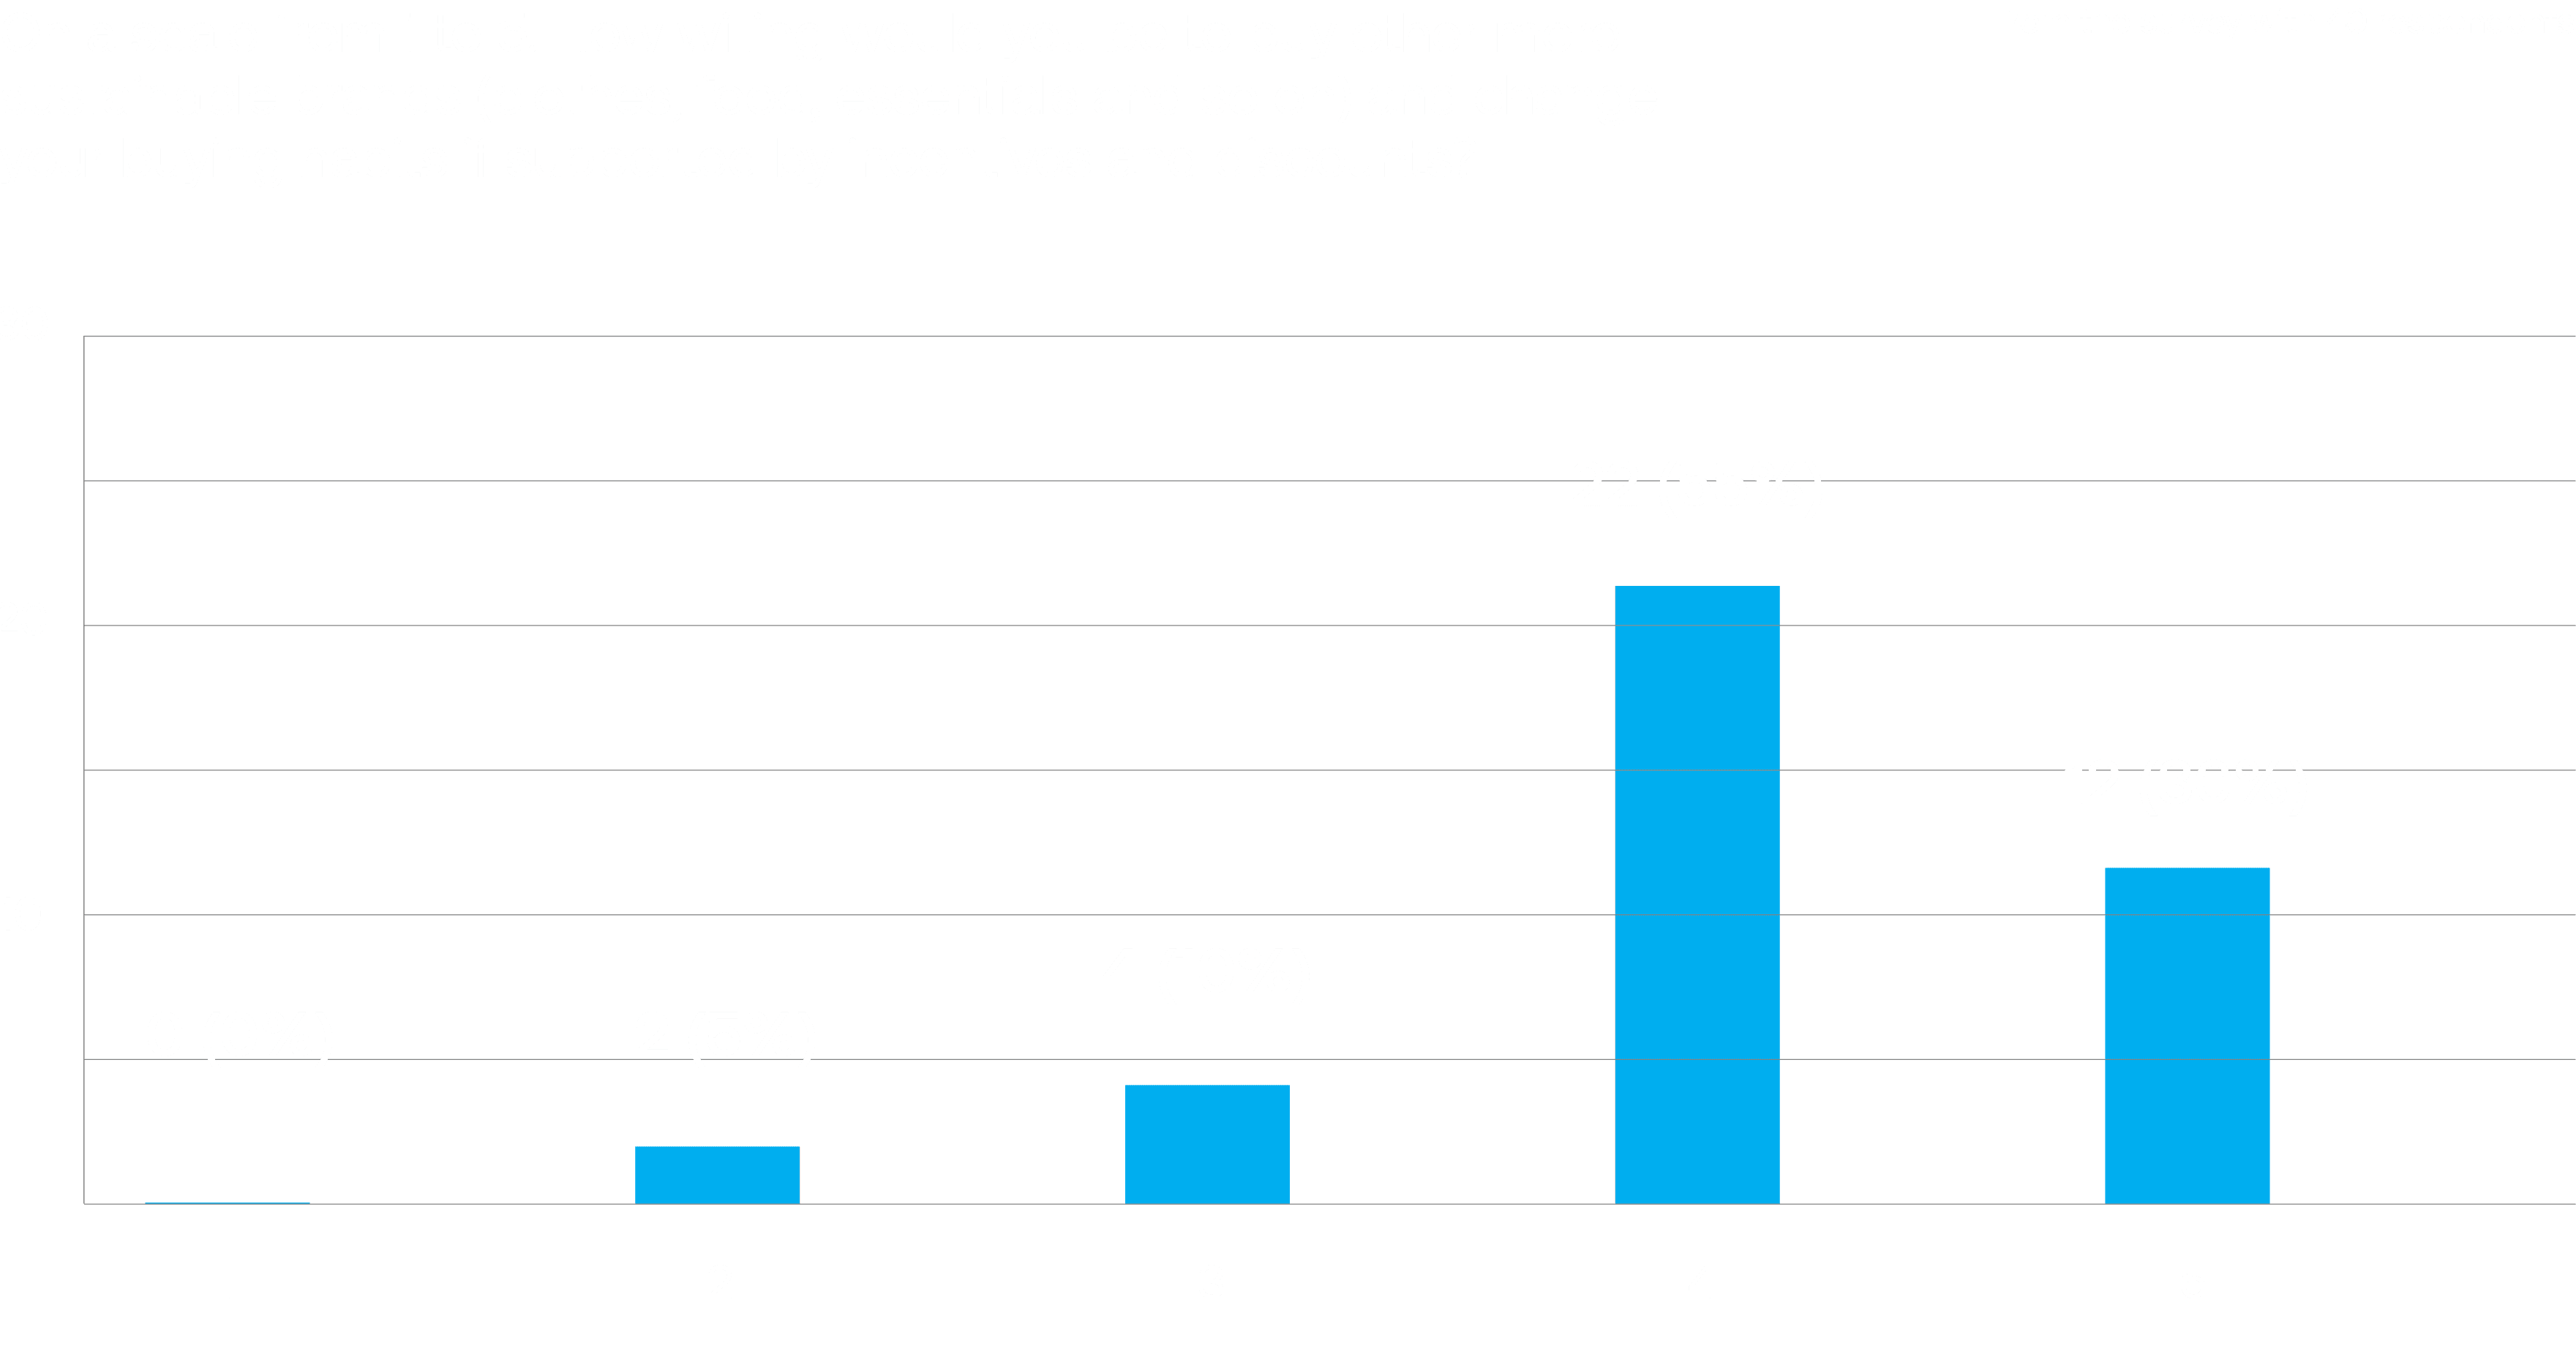
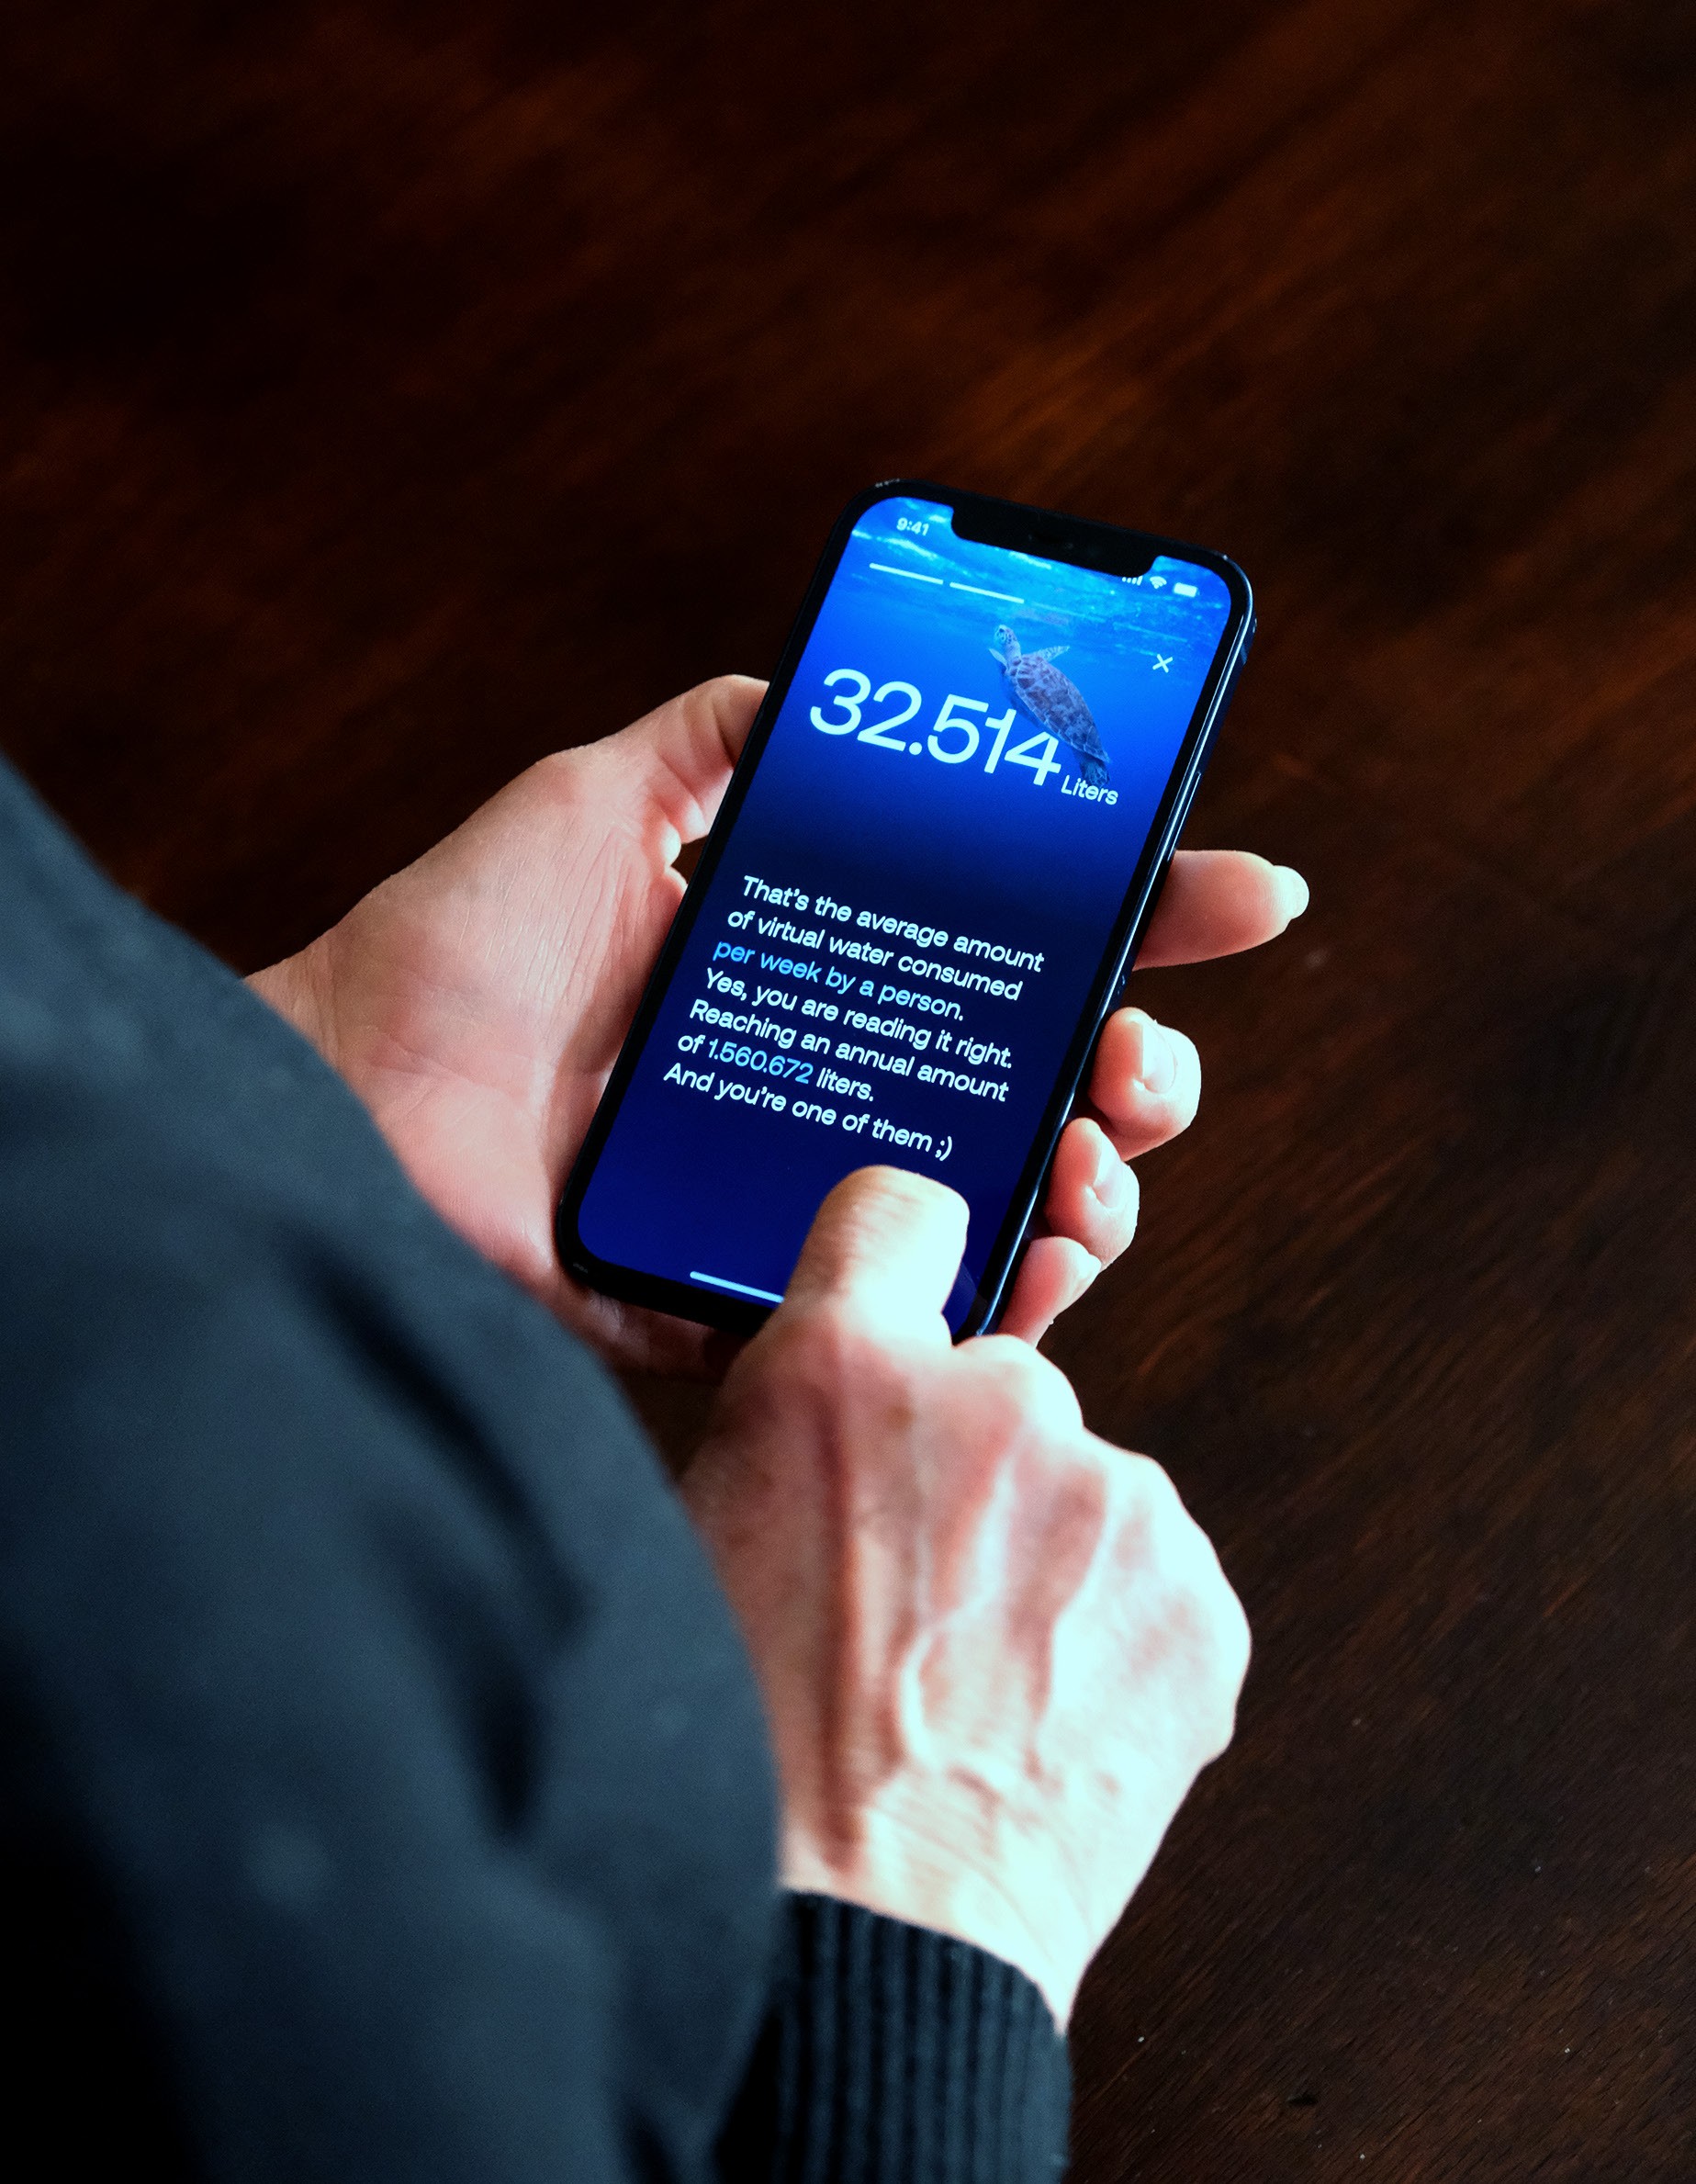
One of the most revealing insights from the research was the gap between perception and reality in people’s understanding of their water consumption. While over half of the survey participants considered themselves well-informed, their responses to specific questions—such as estimating their monthly water use—were often wildly inaccurate. Many gave figures far beyond realistic levels, sometimes equating to what a family of three would consume over several years. This disconnect highlighted a broader issue: despite having access to water daily and even paying for it, most people lack a concrete sense of how much they actually use.
It pointed to a clear need for tools that translate abstract data into meaningful, relatable insights.
Archetypes
Archetypes
Archetypes
To better understand user behaviors and design a solution that resonates with real needs, four user archetypes were developed based on insights gathered through surveys and informal interviews. These archetypes represent recurring patterns in how people perceive, engage with, or avoid the topic of water consumption—particularly virtual water.
To better understand user behaviors and design a solution that resonates with real needs, four user archetypes were developed based on insights gathered through surveys and informal interviews. These archetypes represent recurring patterns in how people perceive, engage with, or avoid the topic of water consumption—particularly virtual water.
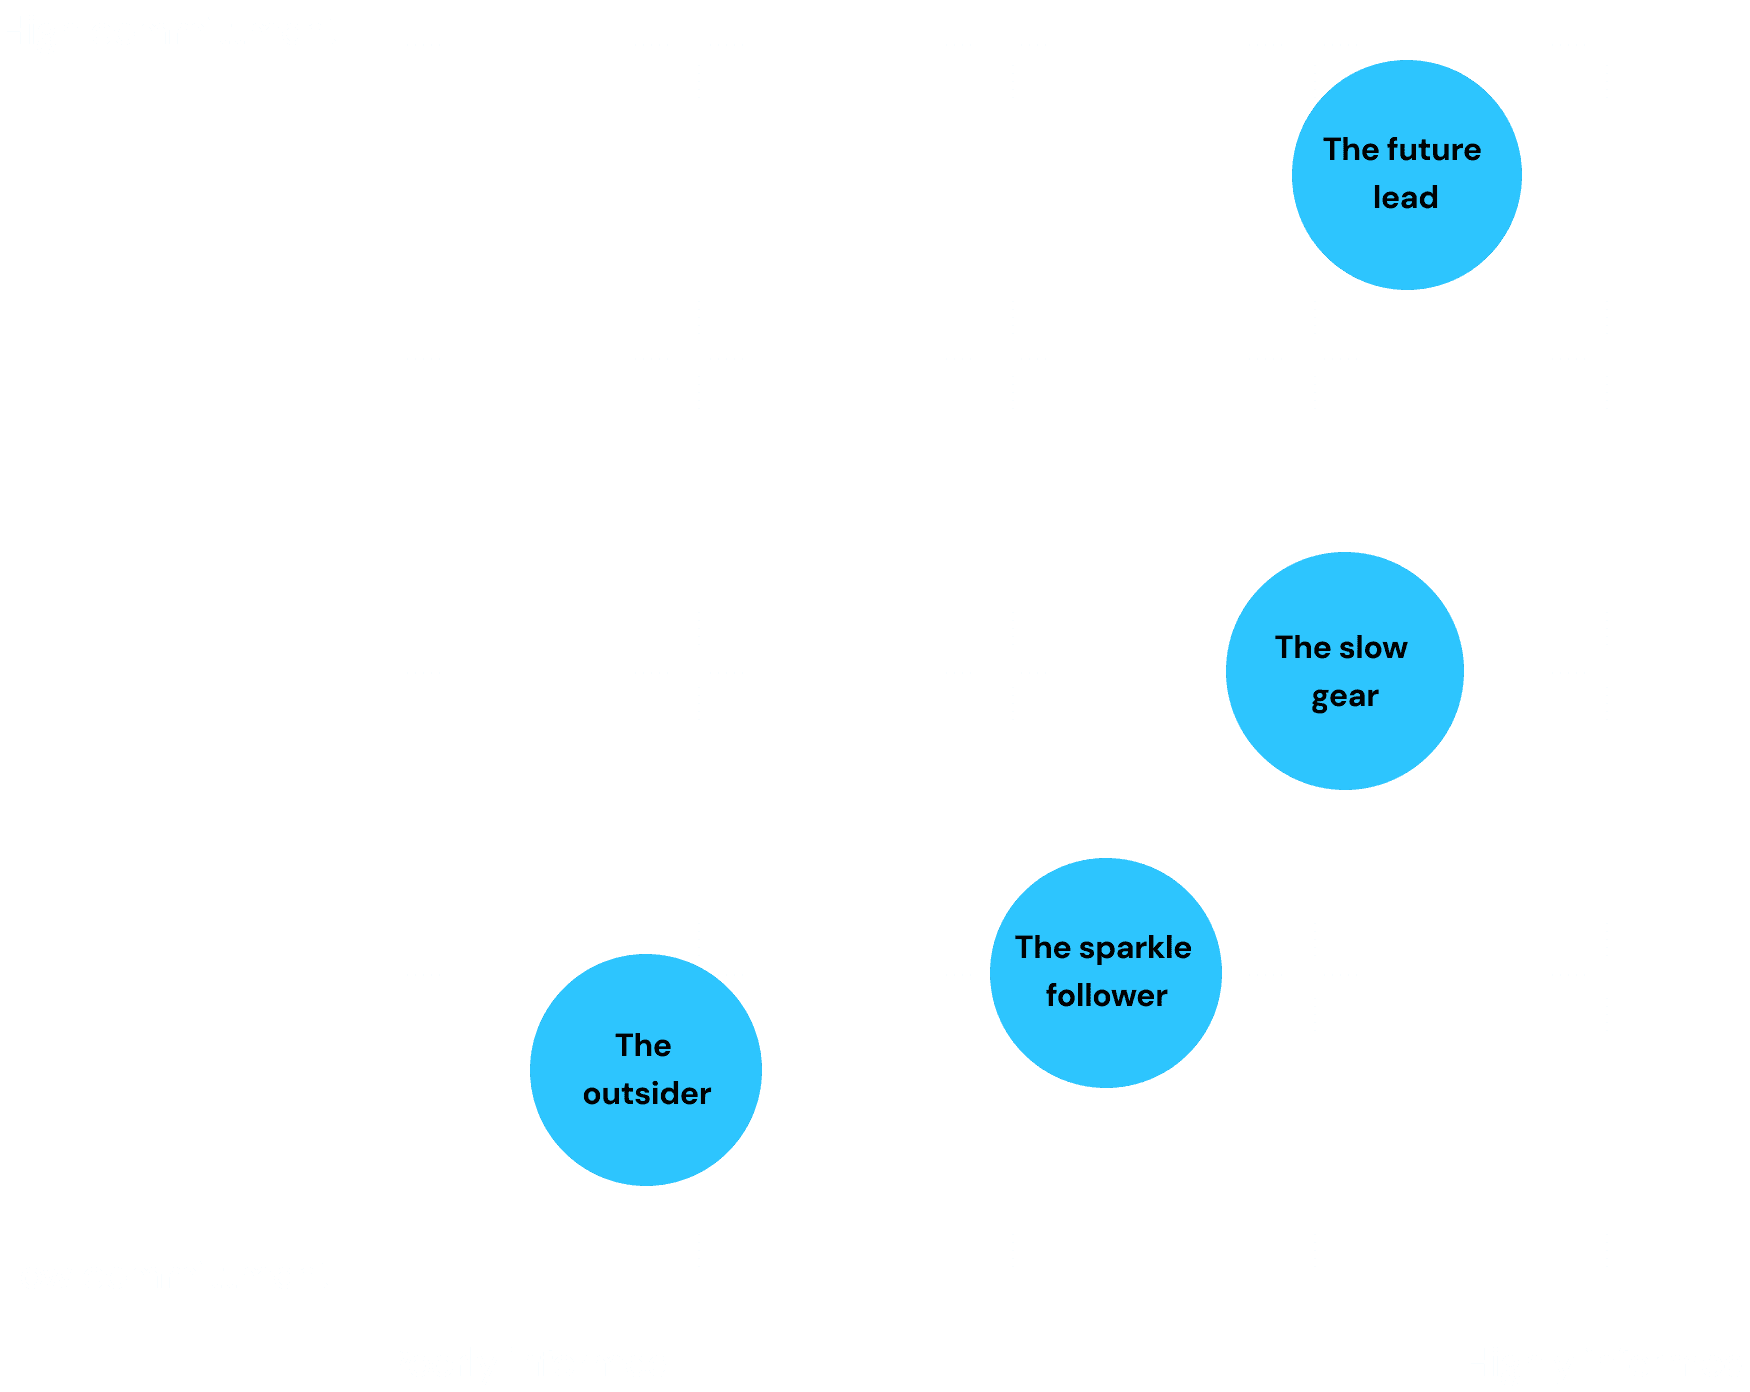
Each archetype captures different levels of awareness, motivation, and action. Some users showed curiosity but lacked the initiative to change habits, while others were highly motivated but felt overwhelmed by the lack of clear guidance or tools. This segmentation allowed the project to move beyond generic user assumptions and instead focus on designing for specific mindsets and behaviors.
The archetypes were instrumental in shaping the concept by identifying which type of user would benefit most from support, incentives, and accessible information. In particular, the design focused on the so-called “sparkle follower” archetype—someone open to change but in need of encouragement and structure—making it a strategic choice for achieving widespread adoption and impact.

Concept Definition
Concept Definition
Concept Definition
The WaterCache concept was shaped in response to the key opportunity areas identified through research: a need for accessible information on water consumption, visibility around virtual water, and support for behavioral change. The proposed solution is a phygital service—a combination of physical and digital touchpoints designed to educate and empower users in making more sustainable choices.
At its core, the system introduces a labeling system that displays the virtual water footprint of products in a clear, user-friendly format. These labels are paired with a mobile app that tracks users’ water footprint based on their purchases, offering insights, alternatives, and even discounts for choosing water-responsible products. The concept also includes future integration with banking systems, enabling users to receive rewards or benefits based on their sustainable choices, while encouraging companies to adopt water-efficient practices.
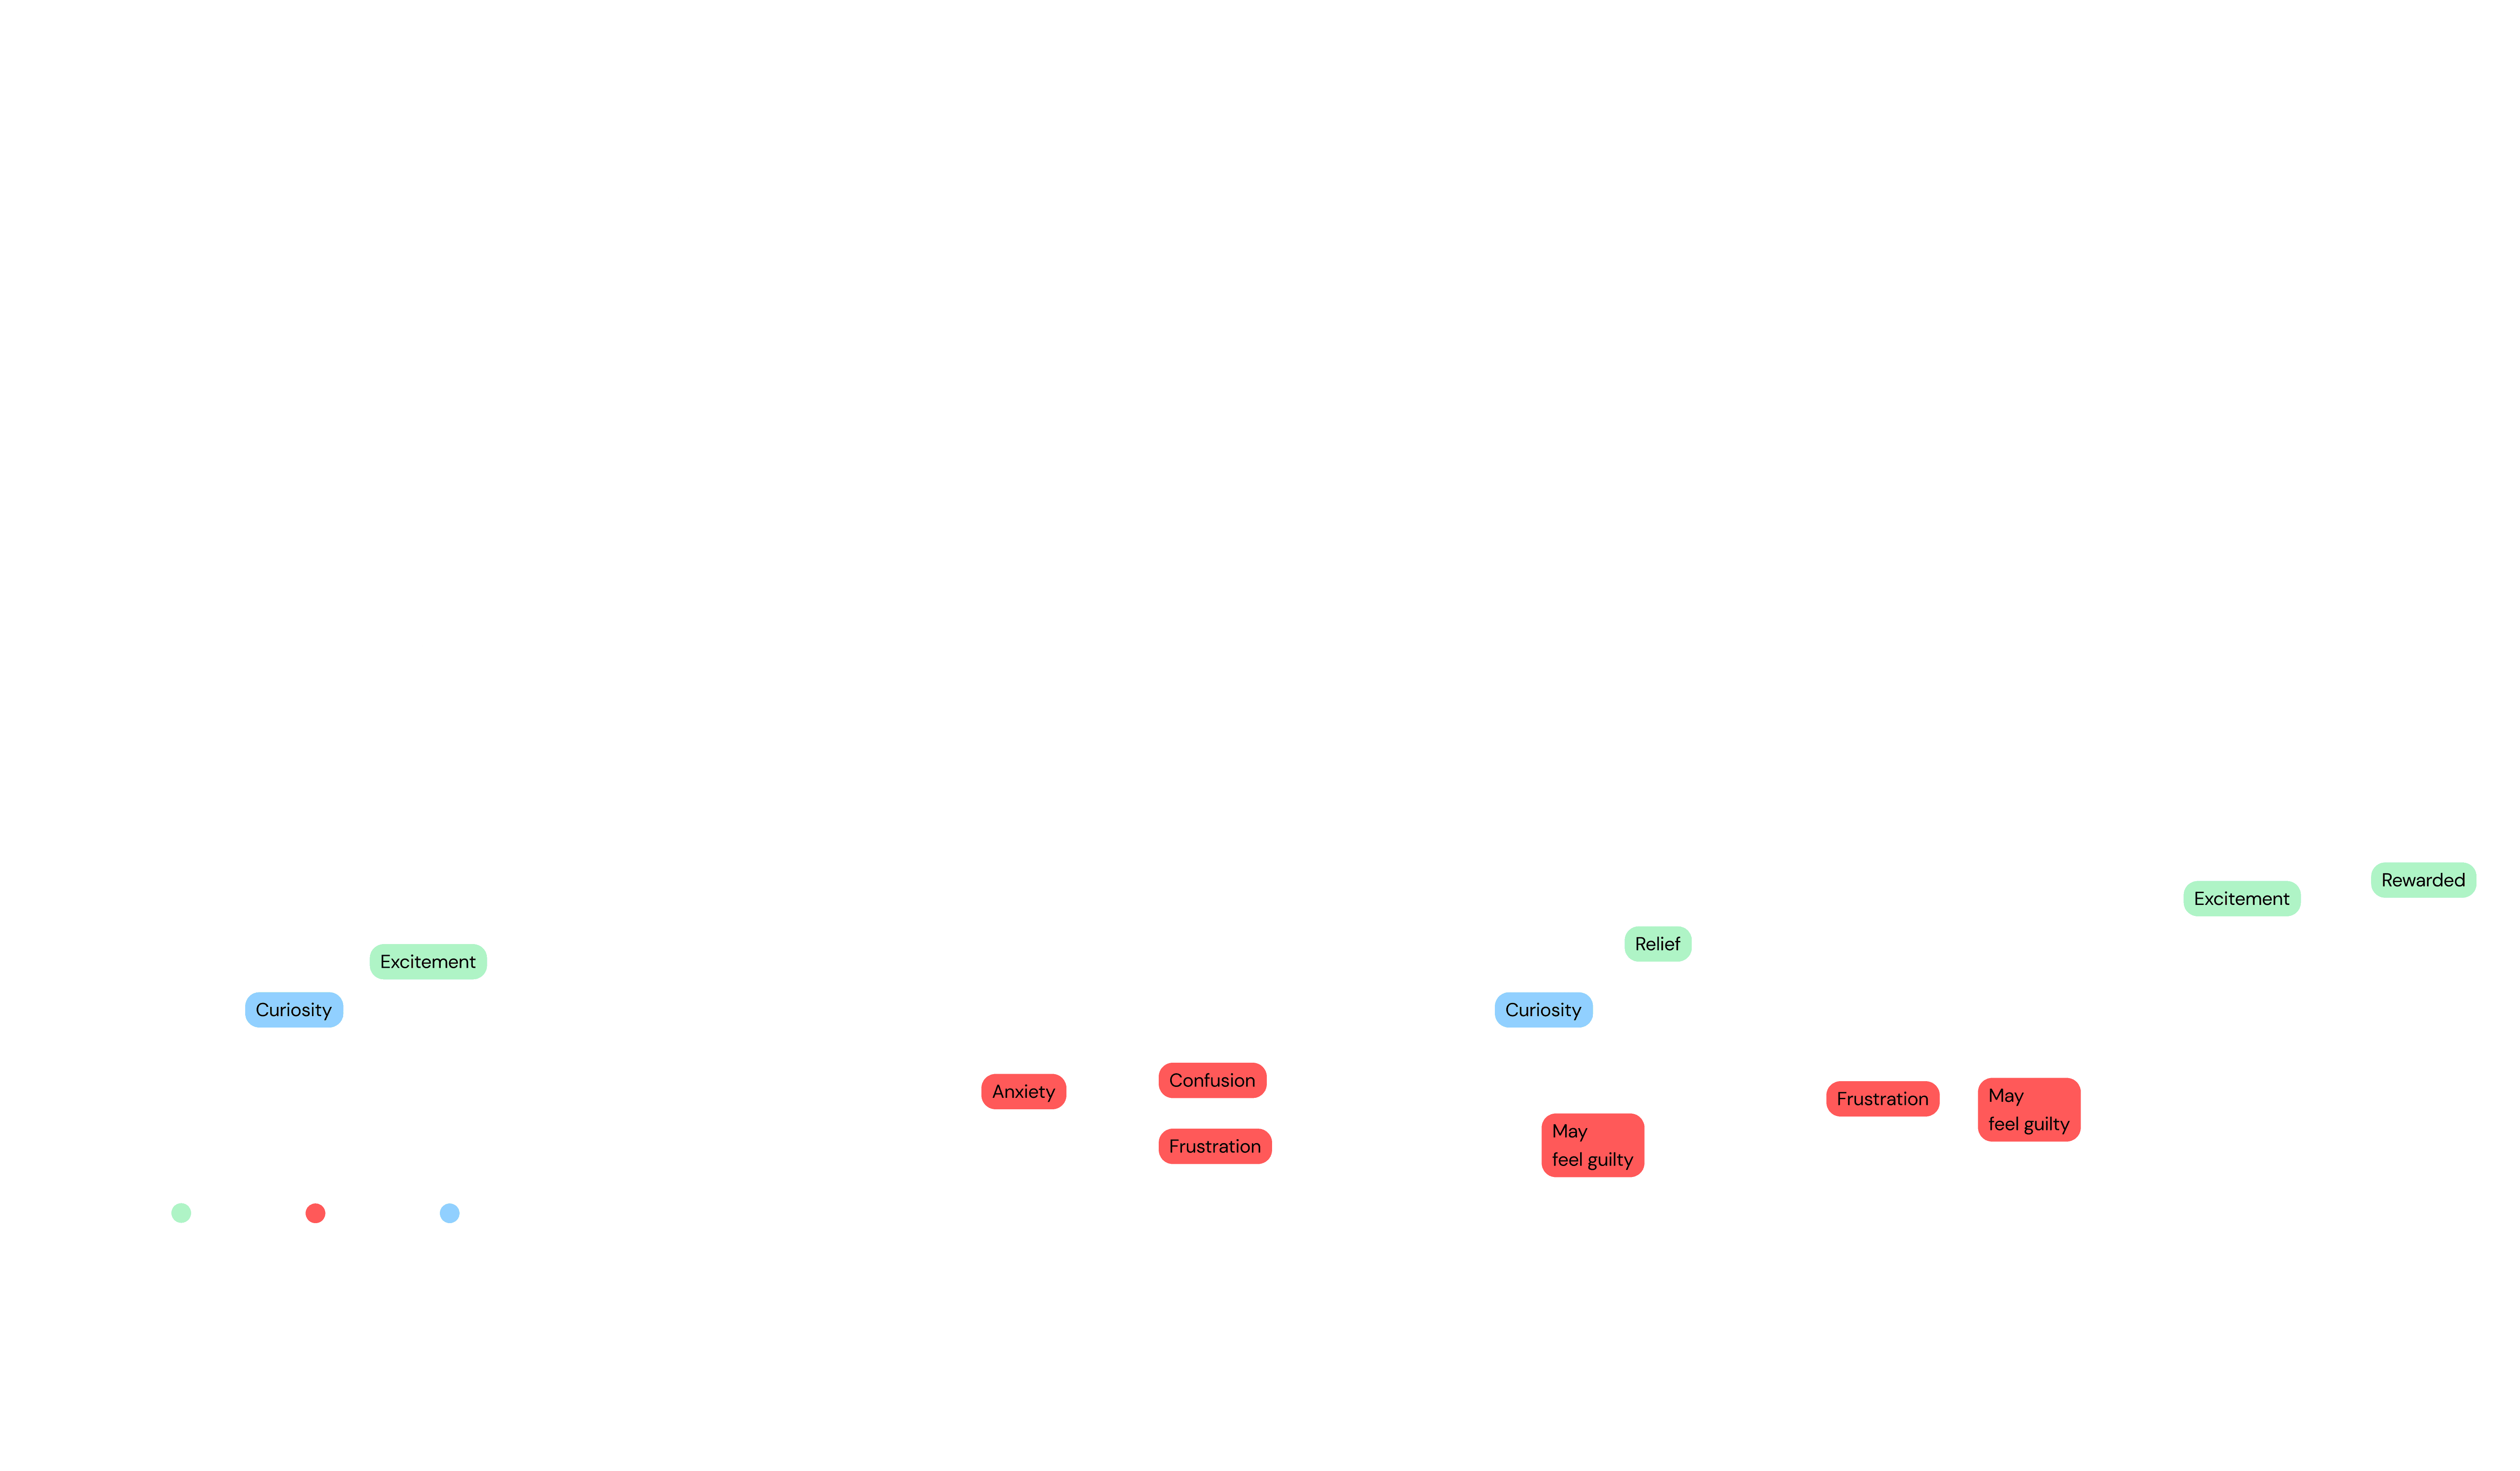
The user journey focuses on Mark, a university student and representative of the “sparkle follower” archetype. His experience illustrates how the service naturally fits into everyday behavior: from scanning product labels at the supermarket, to being informed about virtual water impact, to making a more sustainable choice and receiving a discount. Through this flow, Mark not only becomes more aware of his water footprint but feels supported and incentivized to act on that awareness—demonstrating how design can gently guide users toward long-term, responsible habits.
The user journey focuses on Mark, a university student and representative of the “sparkle follower” archetype. His experience illustrates how the service naturally fits into everyday behavior: from scanning product labels at the supermarket, to being informed about virtual water impact, to making a more sustainable choice and receiving a discount. Through this flow, Mark not only becomes more aware of his water footprint but feels supported and incentivized to act on that awareness—demonstrating how design can gently guide users toward long-term, responsible habits.
Branding
Branding
Branding
The desktop research highlights the growing global water crisis, predicting a 40% supply deficit by 2030. It distinguishes between direct water use (household consumption) and indirect (virtual water in products), emphasizing public unawareness. Agriculture is the largest consumer (70%), followed by industry (20%) and municipalities (10%). Case studies, such as Cape Town’s "Water Wise" campaign and Italy’s Acea Group initiatives, showcase efforts to reduce water waste. However, the research identifies a gap in consumer awareness and access to water footprint data, stressing the need for systemic and digital solutions.
The desktop research highlights the growing global water crisis, predicting a 40% supply deficit by 2030. It distinguishes between direct water use (household consumption) and indirect (virtual water in products), emphasizing public unawareness. Agriculture is the largest consumer (70%), followed by industry (20%) and municipalities (10%). Case studies, such as Cape Town’s "Water Wise" campaign and Italy’s Acea Group initiatives, showcase efforts to reduce water waste. However, the research identifies a gap in consumer awareness and access to water footprint data, stressing the need for systemic and digital solutions.


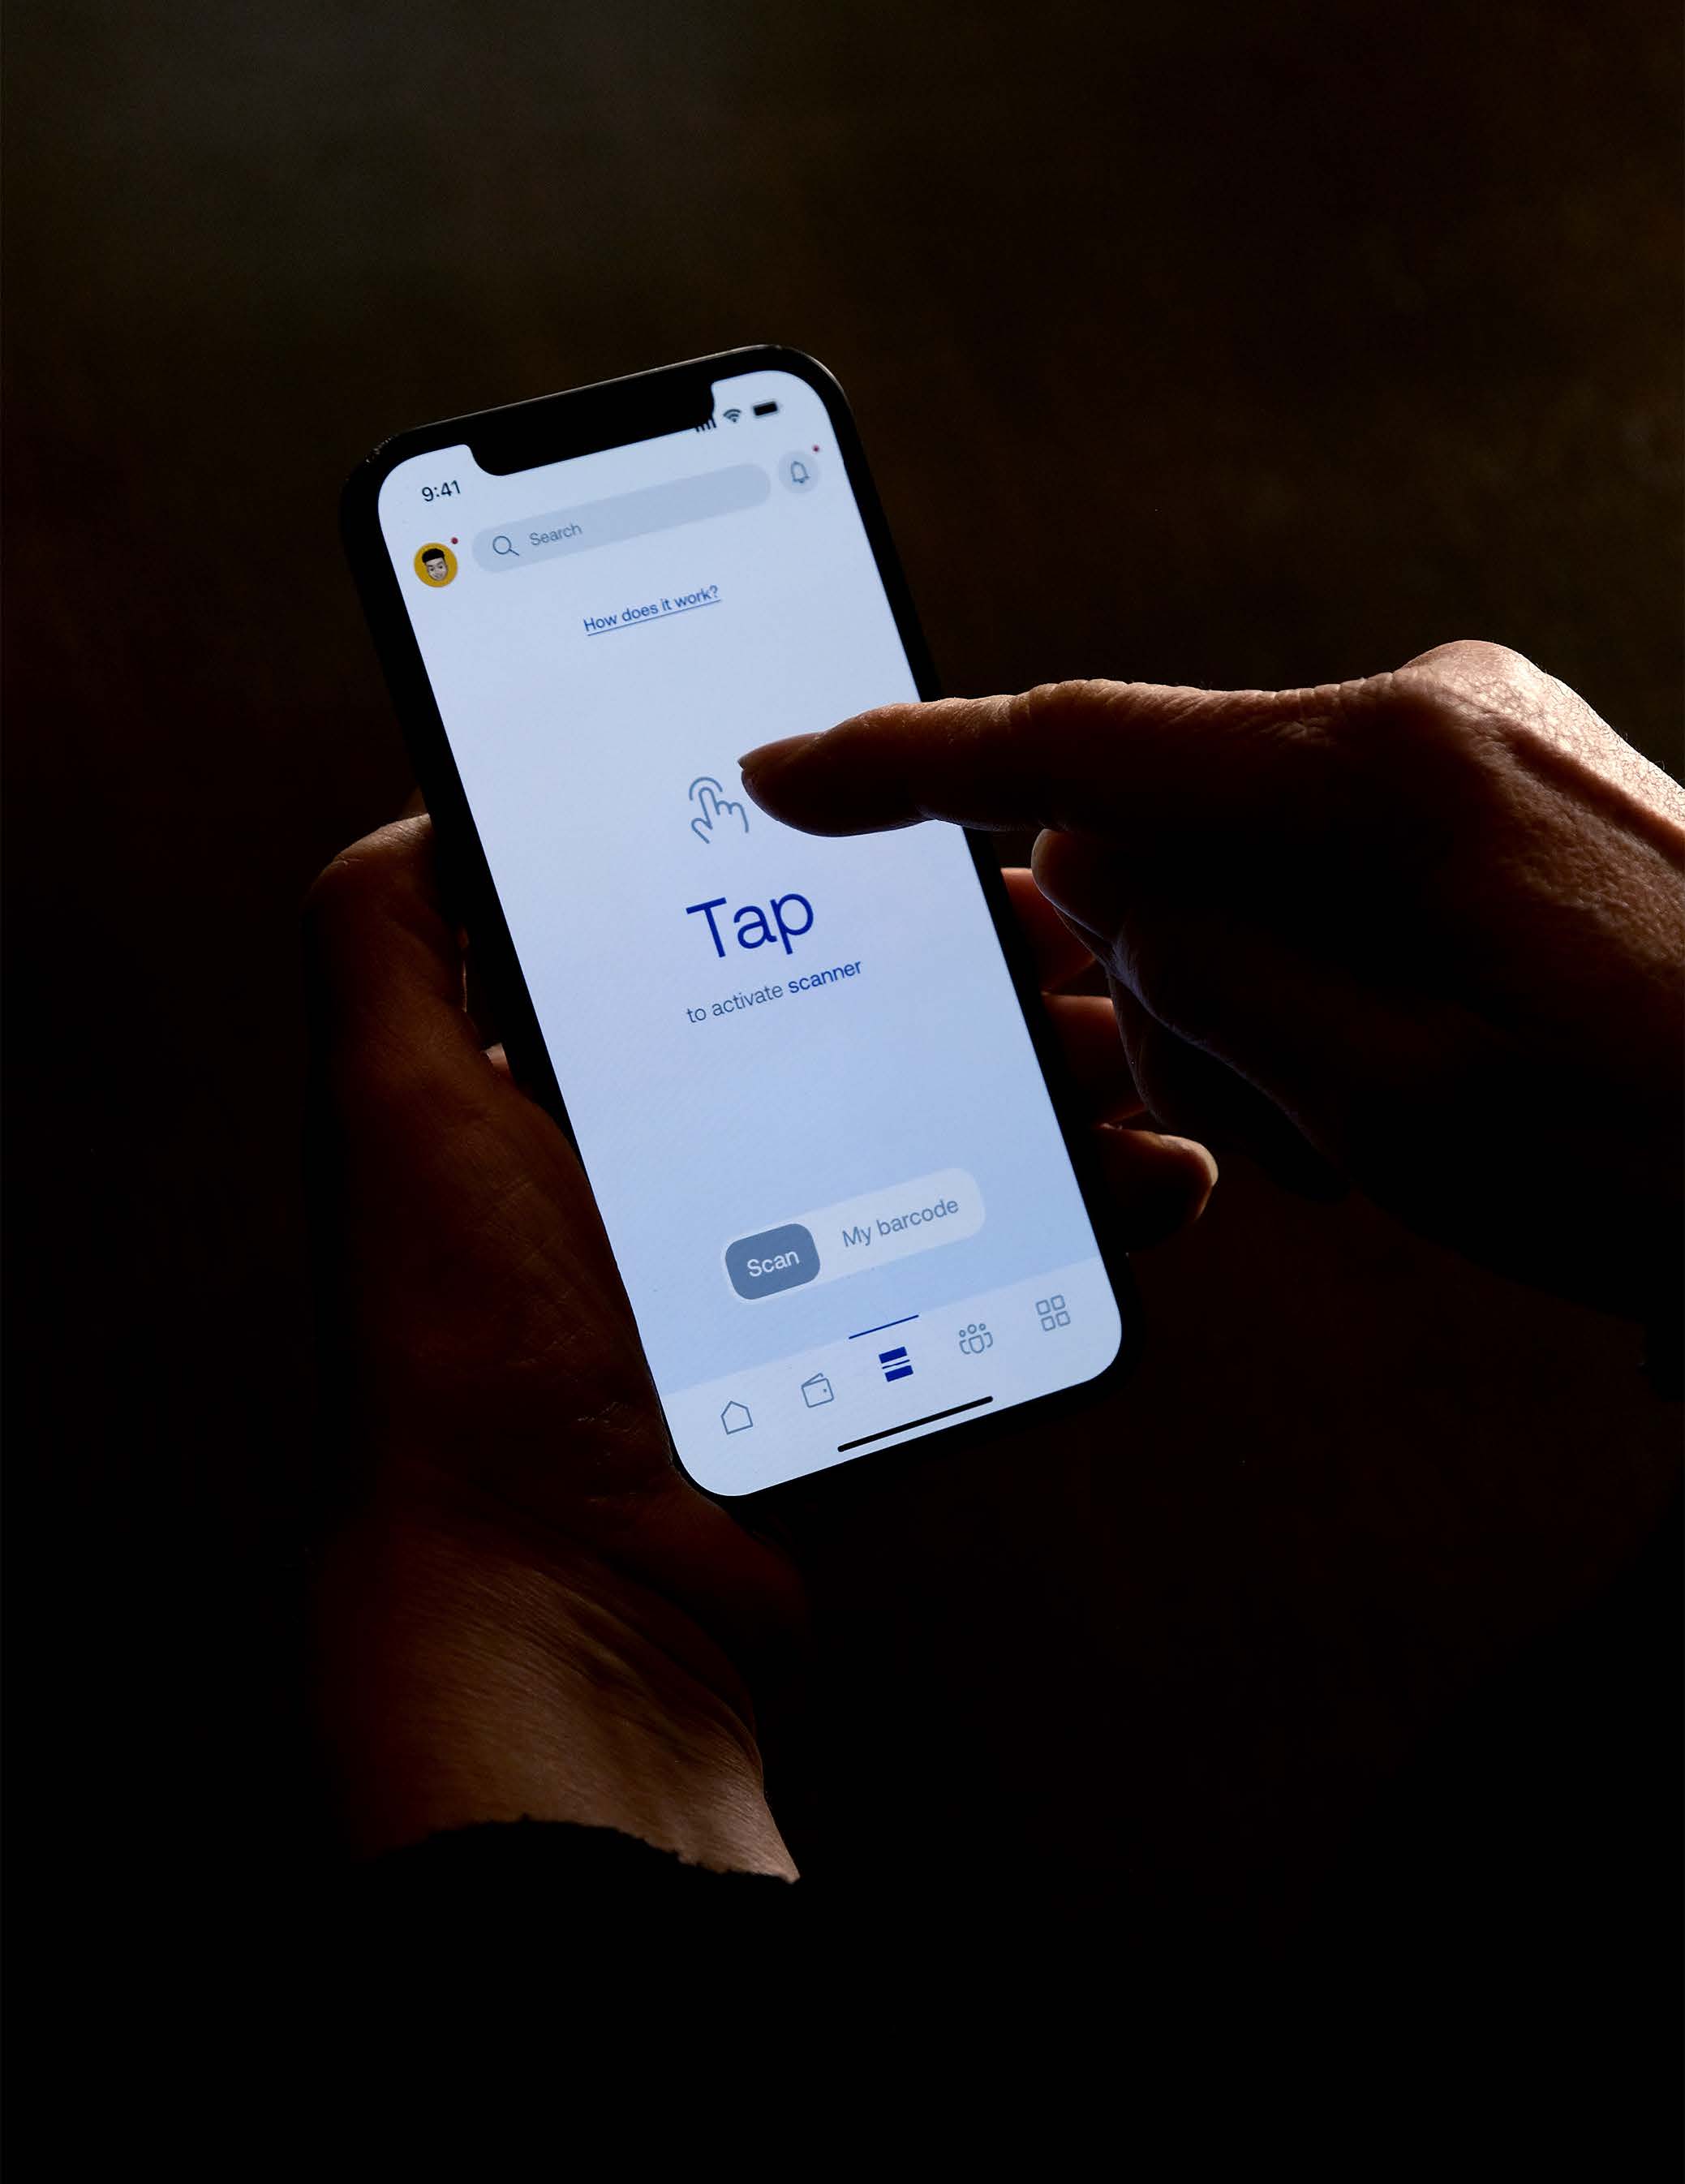
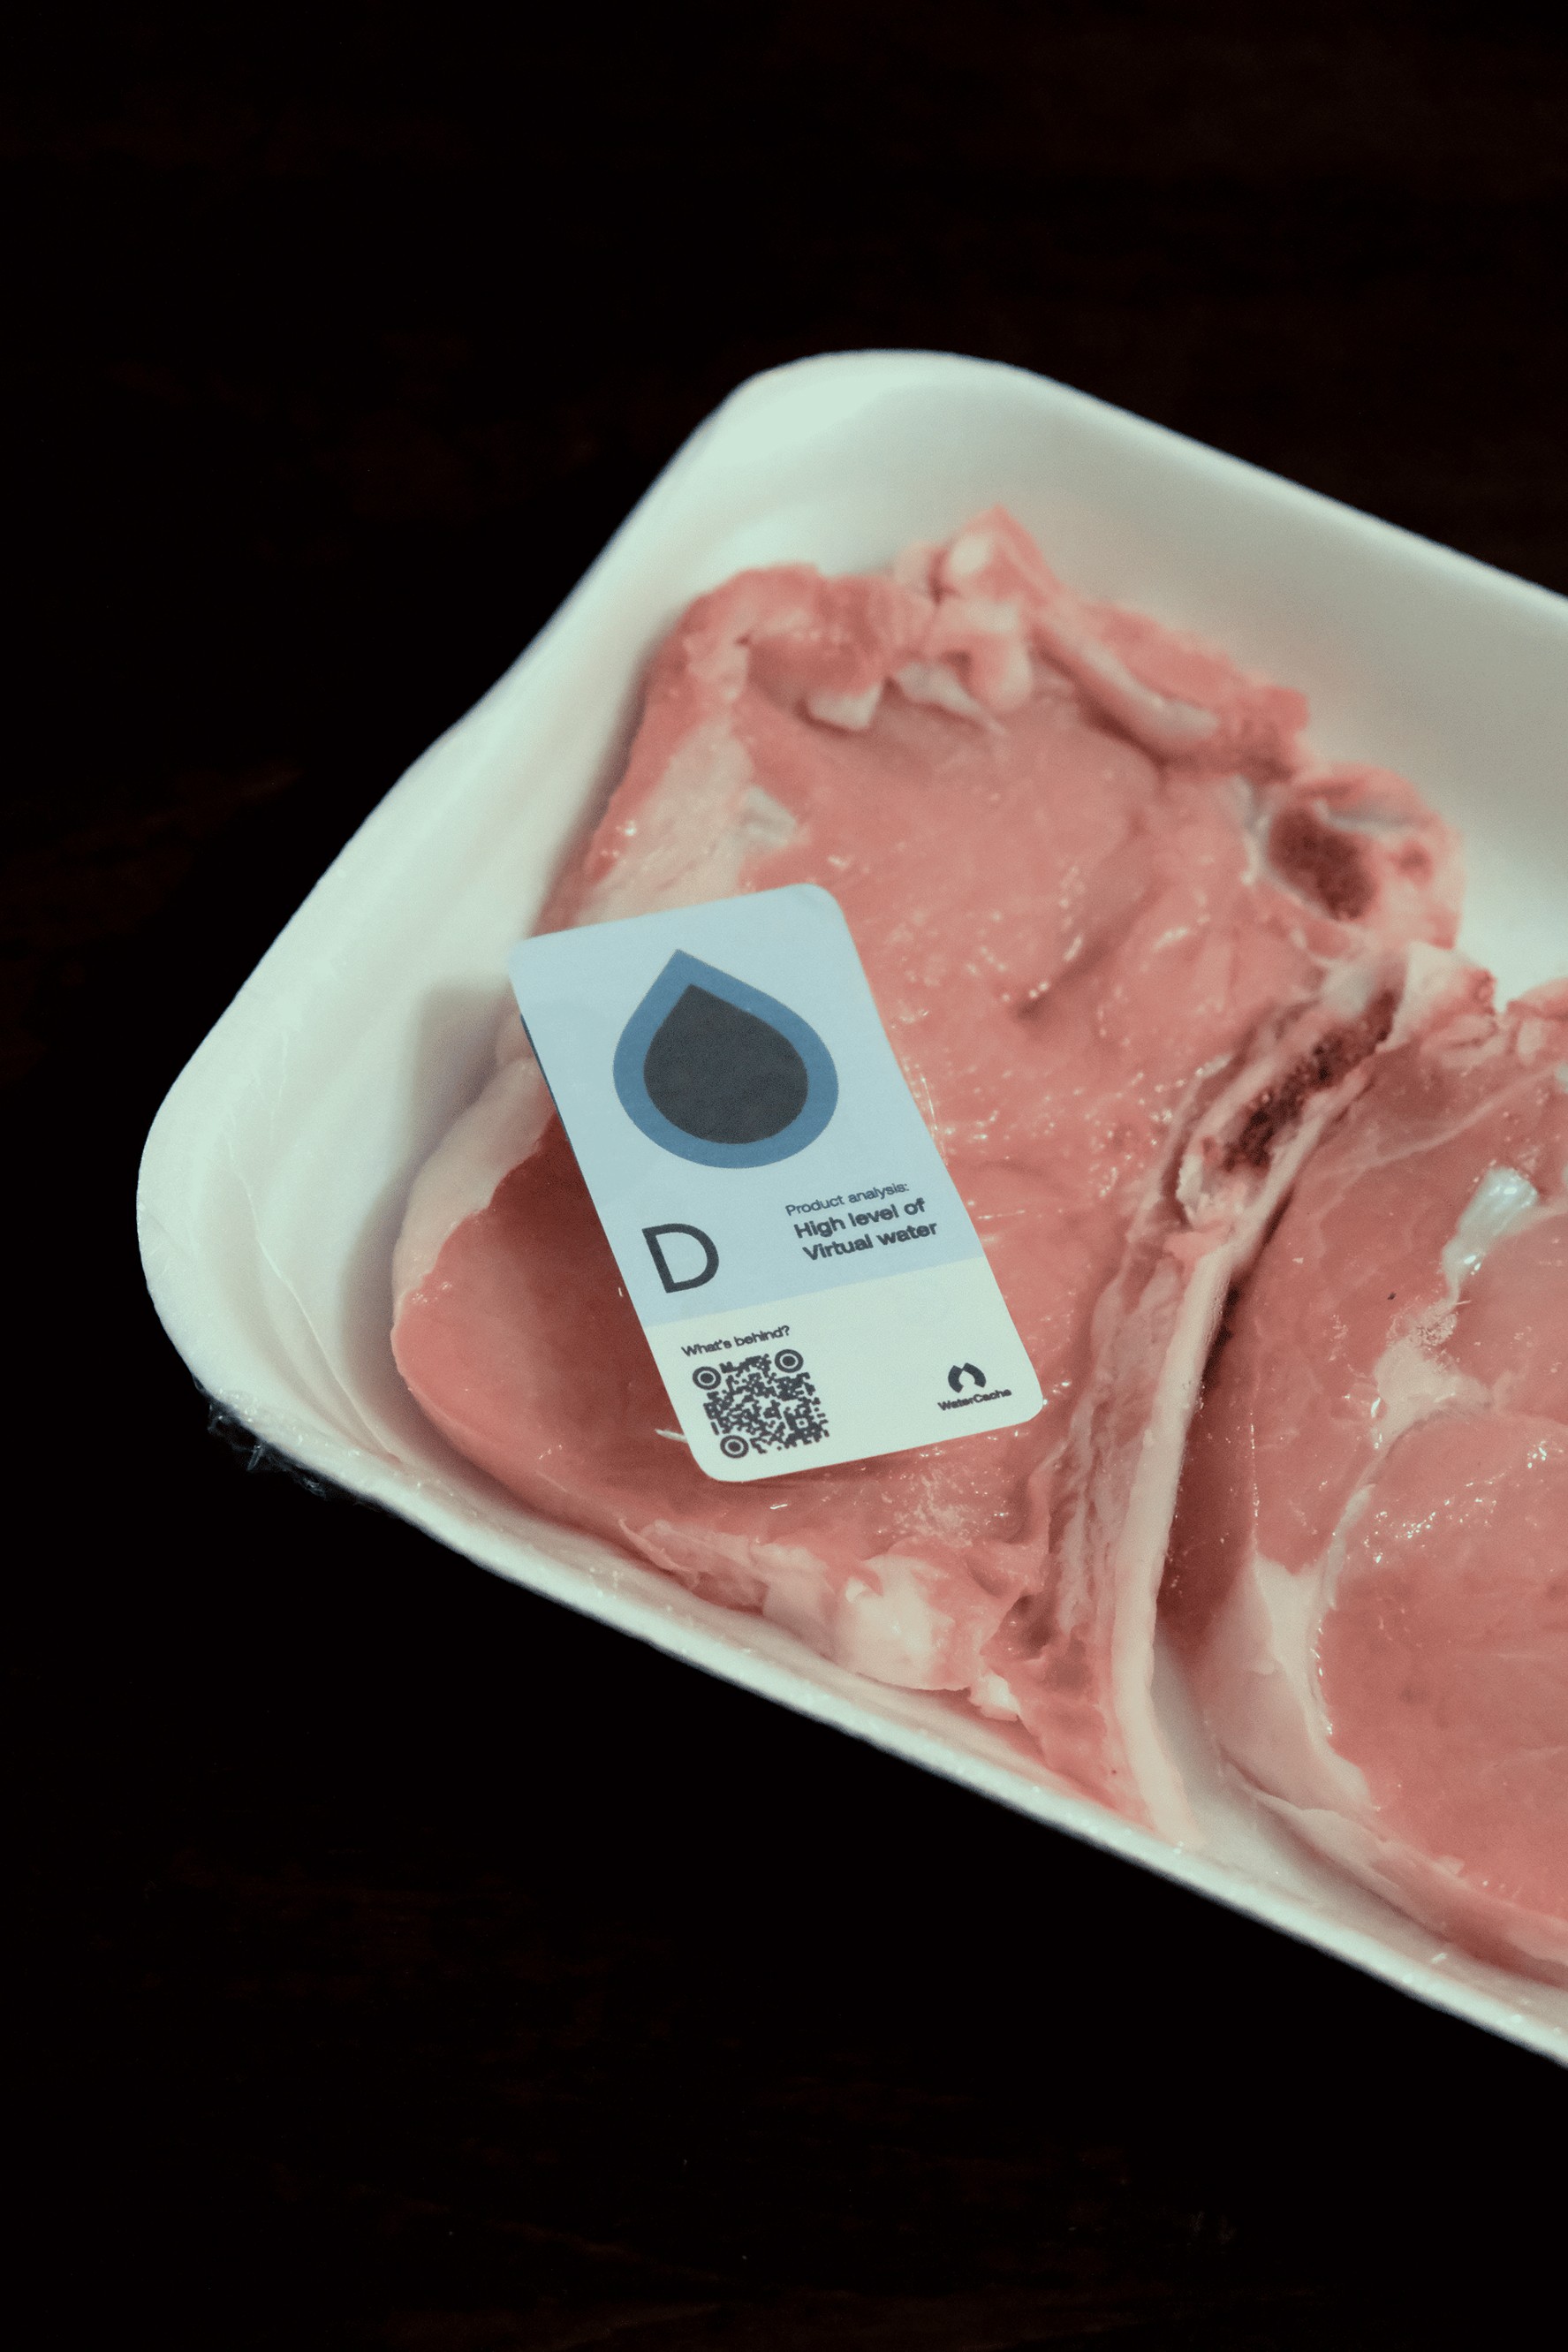
A key component of the WaterCache concept is the labeling system, designed to make virtual water consumption visible and actionable at the point of purchase. Today, consumers have access to information like price, ingredients, or origin—but not the hidden water cost of a product.
The labeling system addresses this gap by introducing a simple, intuitive visual cue (like a class rating or QR code) directly on product packaging. These labels allow users to instantly compare products based on their virtual water footprint, encouraging more sustainable choices.
When scanned, the labels connect to the WaterCache app, unlocking detailed insights, alternative suggestions, and even discounts for selecting lower-impact items. The system is not only aimed at informing consumers but also at incentivizing businesses to adopt more transparent and water-conscious production methods. In this way, the labeling becomes a bridge between design, education, and environmental responsibility—turning invisible data into a visible driver of change.

Wireframes and Design system
Wireframes and Design system
Wireframes and Design system
The Design System was developed as a foundational toolkit to ensure consistency, accessibility, and efficiency across the WaterCache application. It includes a structured set of components—such as color styles, typography, iconography, buttons, and layout grids—all created in Figma. The system centers around a clear visual identity, using Klein Blue as the primary color for its strong association with water and trust, complemented by a set of secondary and alert colors. Special attention was given to accessibility, with all contrast ratios tested to meet WCAG standards.
Typography was carefully chosen to support clarity and readability, with Aeonik selected for its balance of modern style and functional legibility. The design system also defines button states and interaction patterns to streamline UI development, creating a unified and intuitive user experience across all touchpoints.
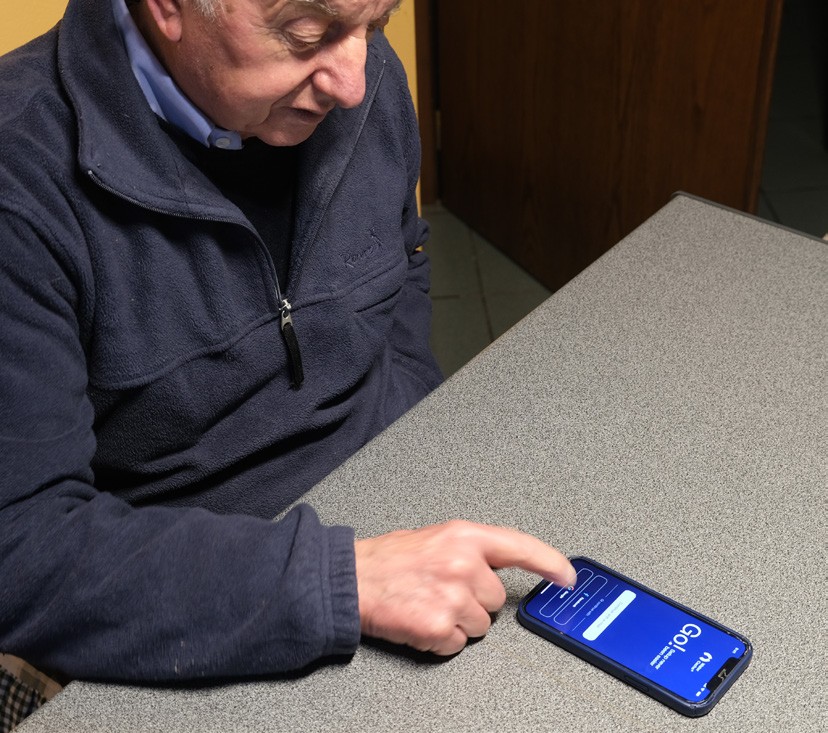
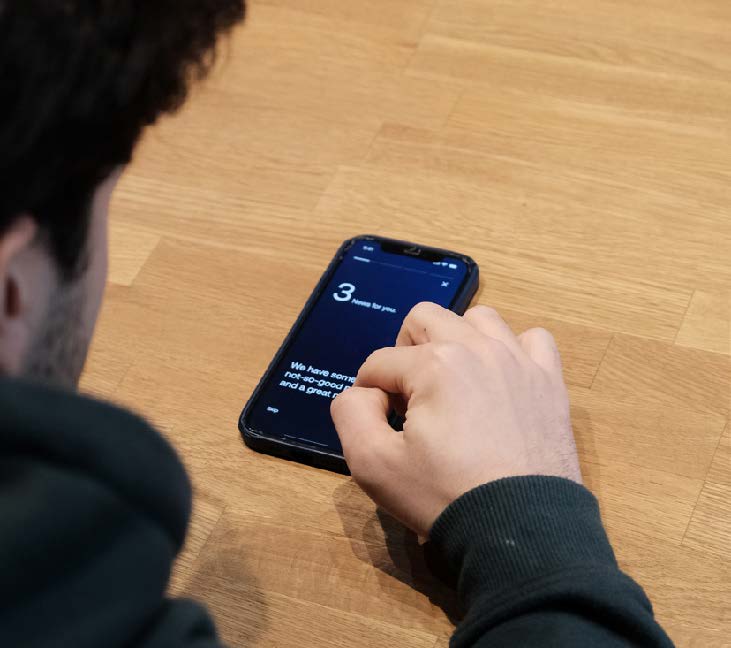
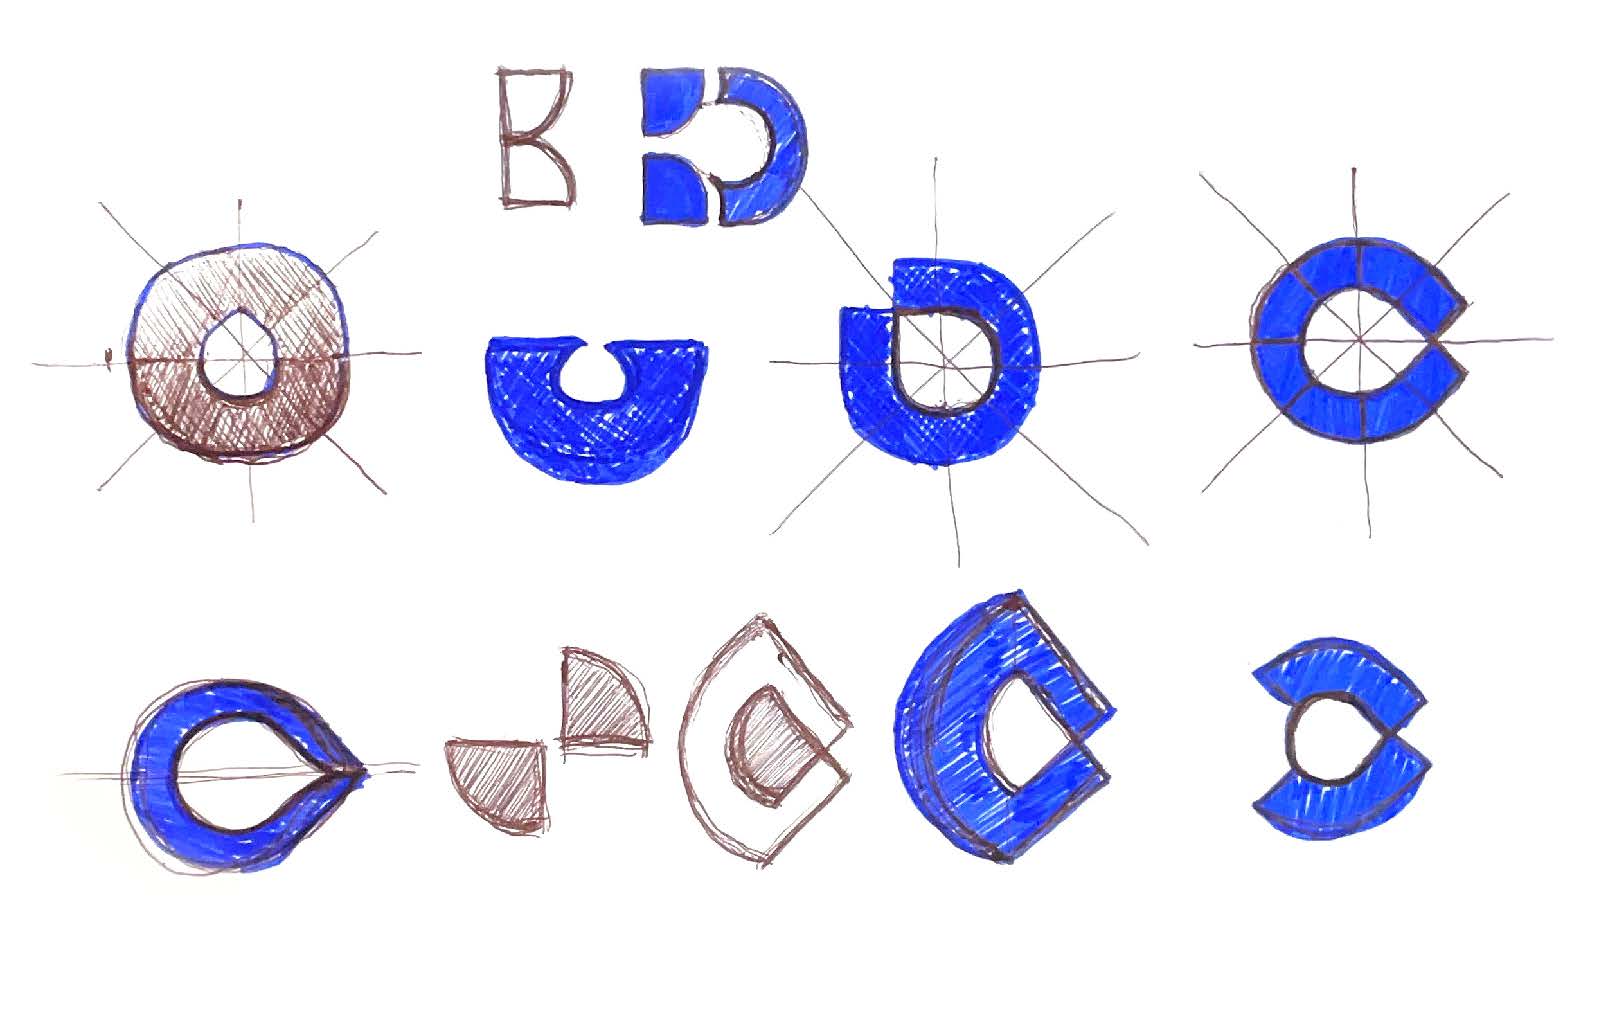
In the Wireframes phase, early sketches were translated into low-fidelity screens to explore key user flows—onboarding, product scanning, community engagement, and personal water footprint tracking. These wireframes laid the groundwork for testing usability and refining structure before moving into visual design. They also served to validate how the app would support users in making more conscious choices, offering clear guidance at every stage of interaction.
The Design System was developed as a foundational toolkit to ensure consistency, accessibility, and efficiency across the WaterCache application. It includes a structured set of components—such as color styles, typography, iconography, buttons, and layout grids—all created in Figma. The system centers around a clear visual identity, using Klein Blue as the primary color for its strong association with water and trust, complemented by a set of secondary and alert colors. Special attention was given to accessibility, with all contrast ratios tested to meet WCAG standards.
Typography was carefully chosen to support clarity and readability, with Aeonik selected for its balance of modern style and functional legibility. The design system also defines button states and interaction patterns to streamline UI development, creating a unified and intuitive user experience across all touchpoints.
In the Wireframes phase, early sketches were translated into low-fidelity screens to explore key user flows—onboarding, product scanning, community engagement, and personal water footprint tracking. These wireframes laid the groundwork for testing usability and refining structure before moving into visual design. They also served to validate how the app would support users in making more conscious choices, offering clear guidance at every stage of interaction.


Information Architecture
Information Architecture
Information Architecture
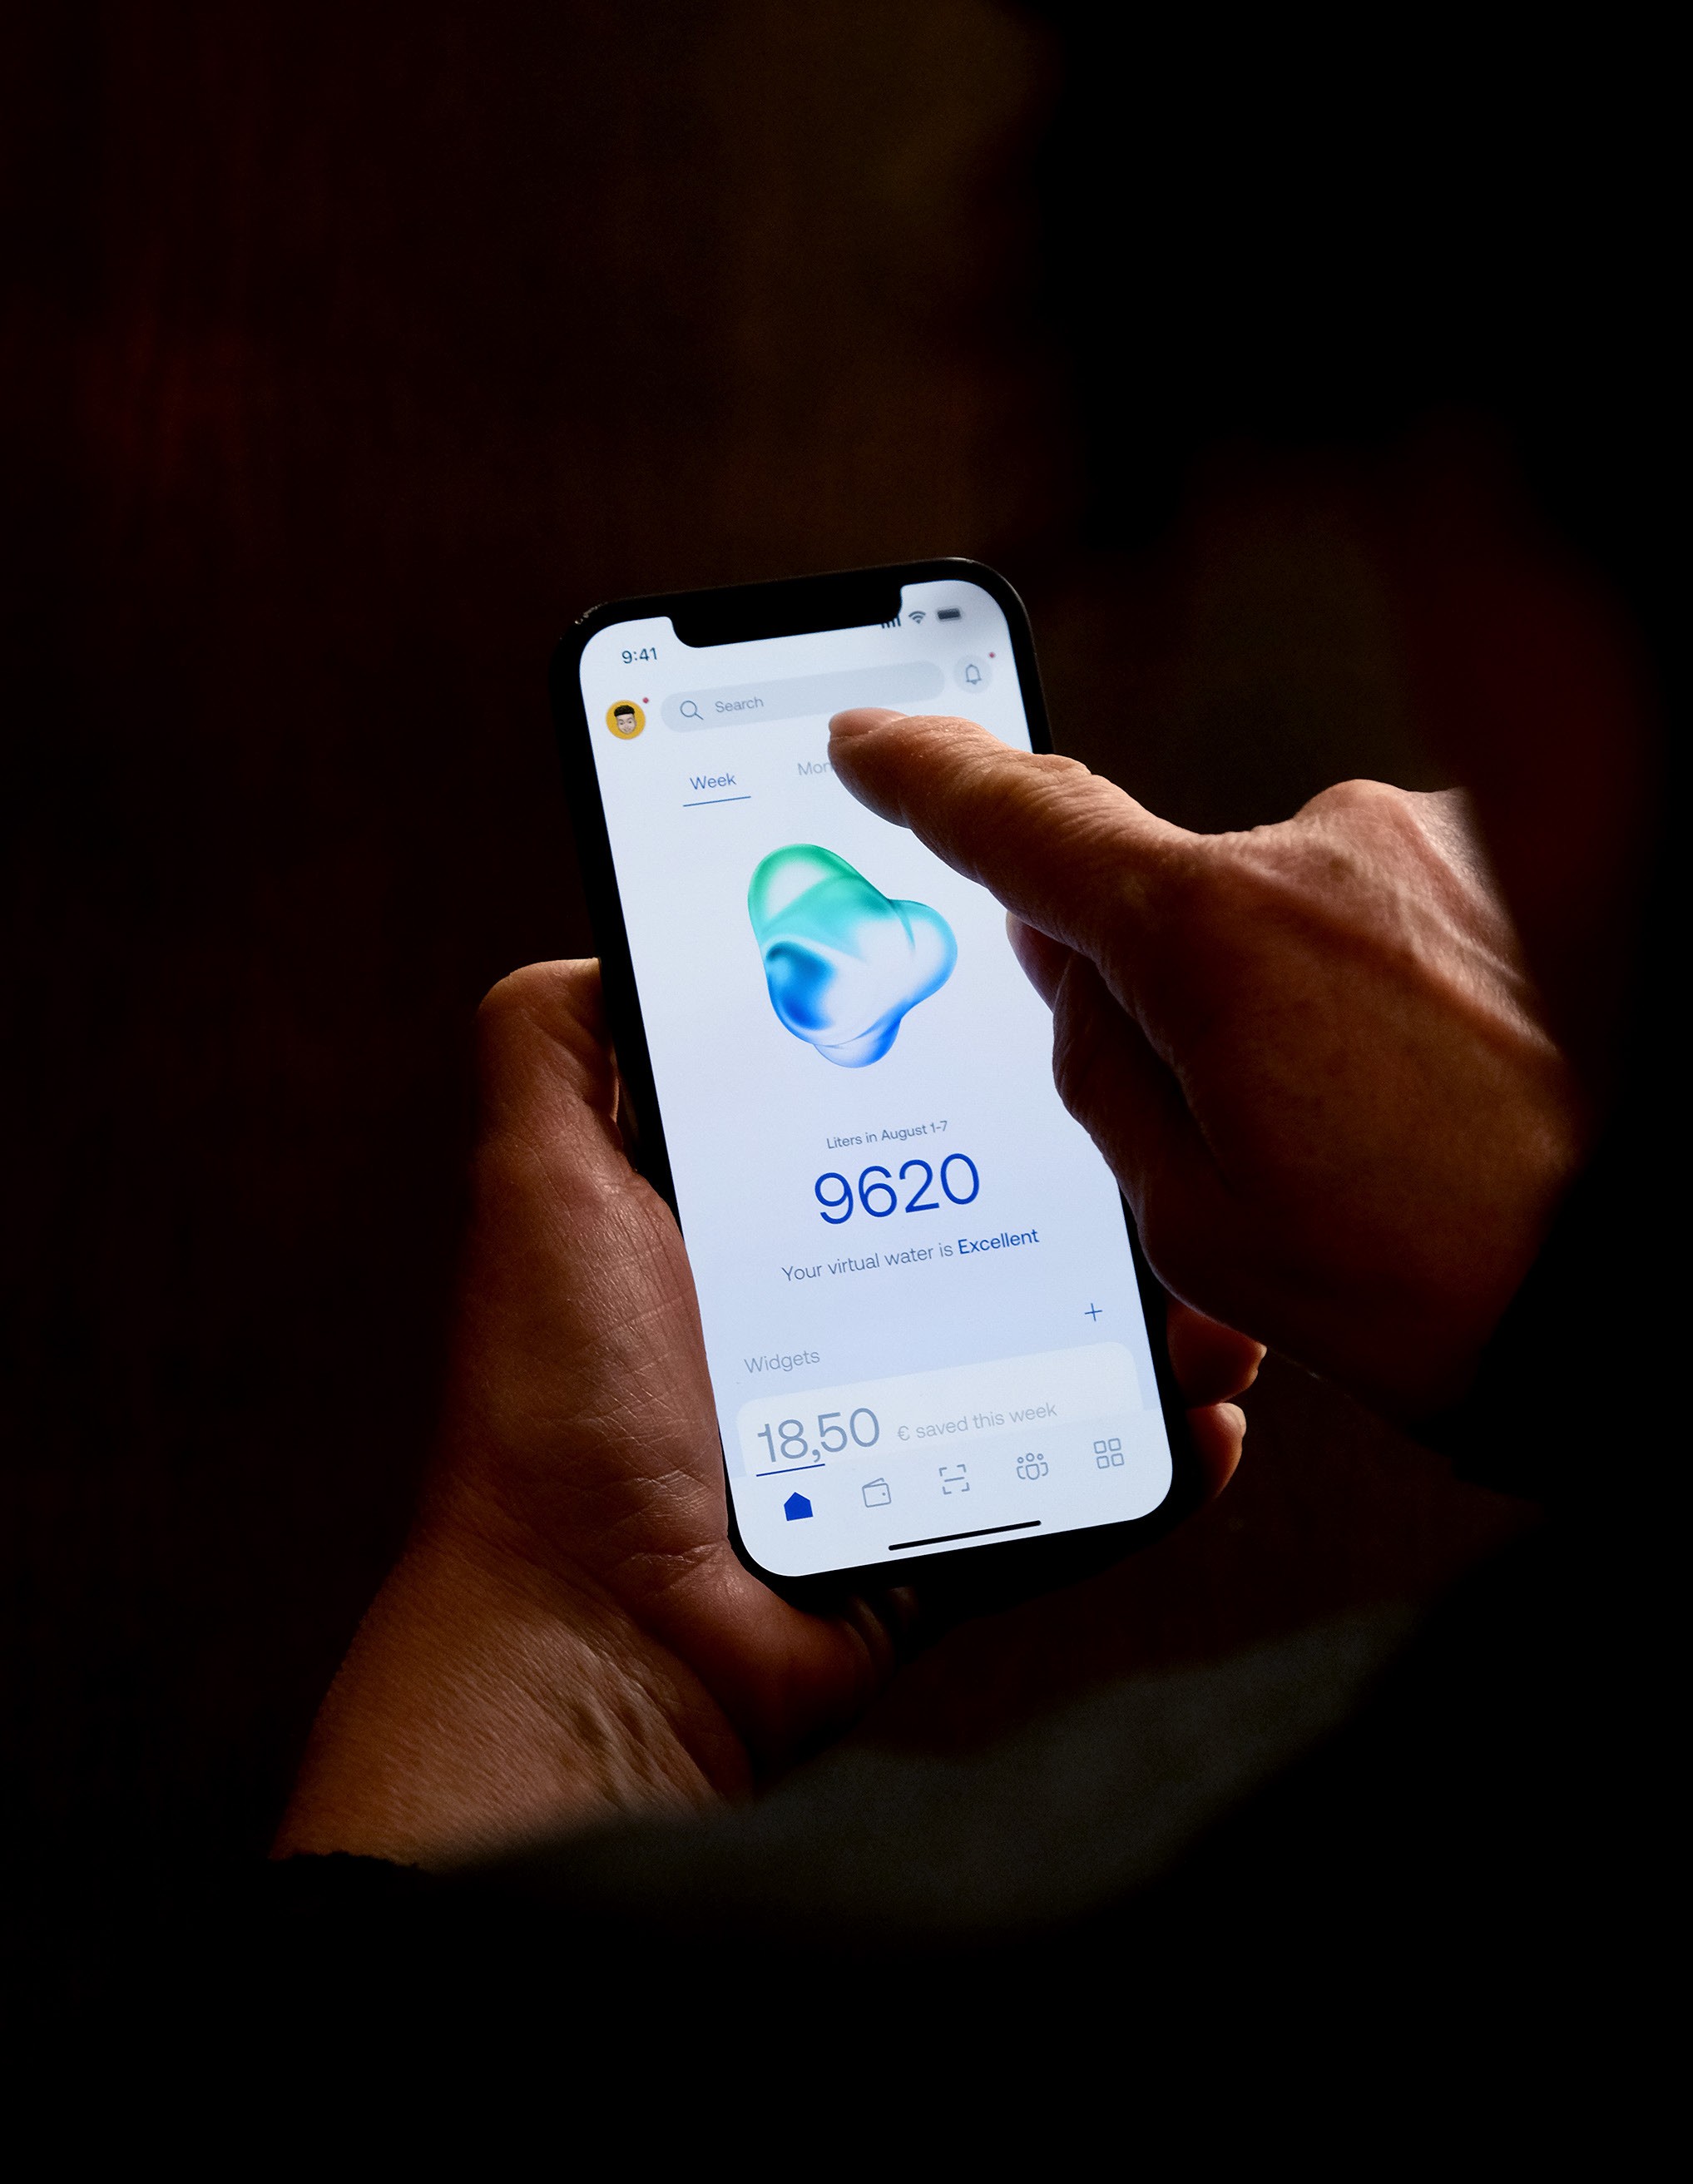
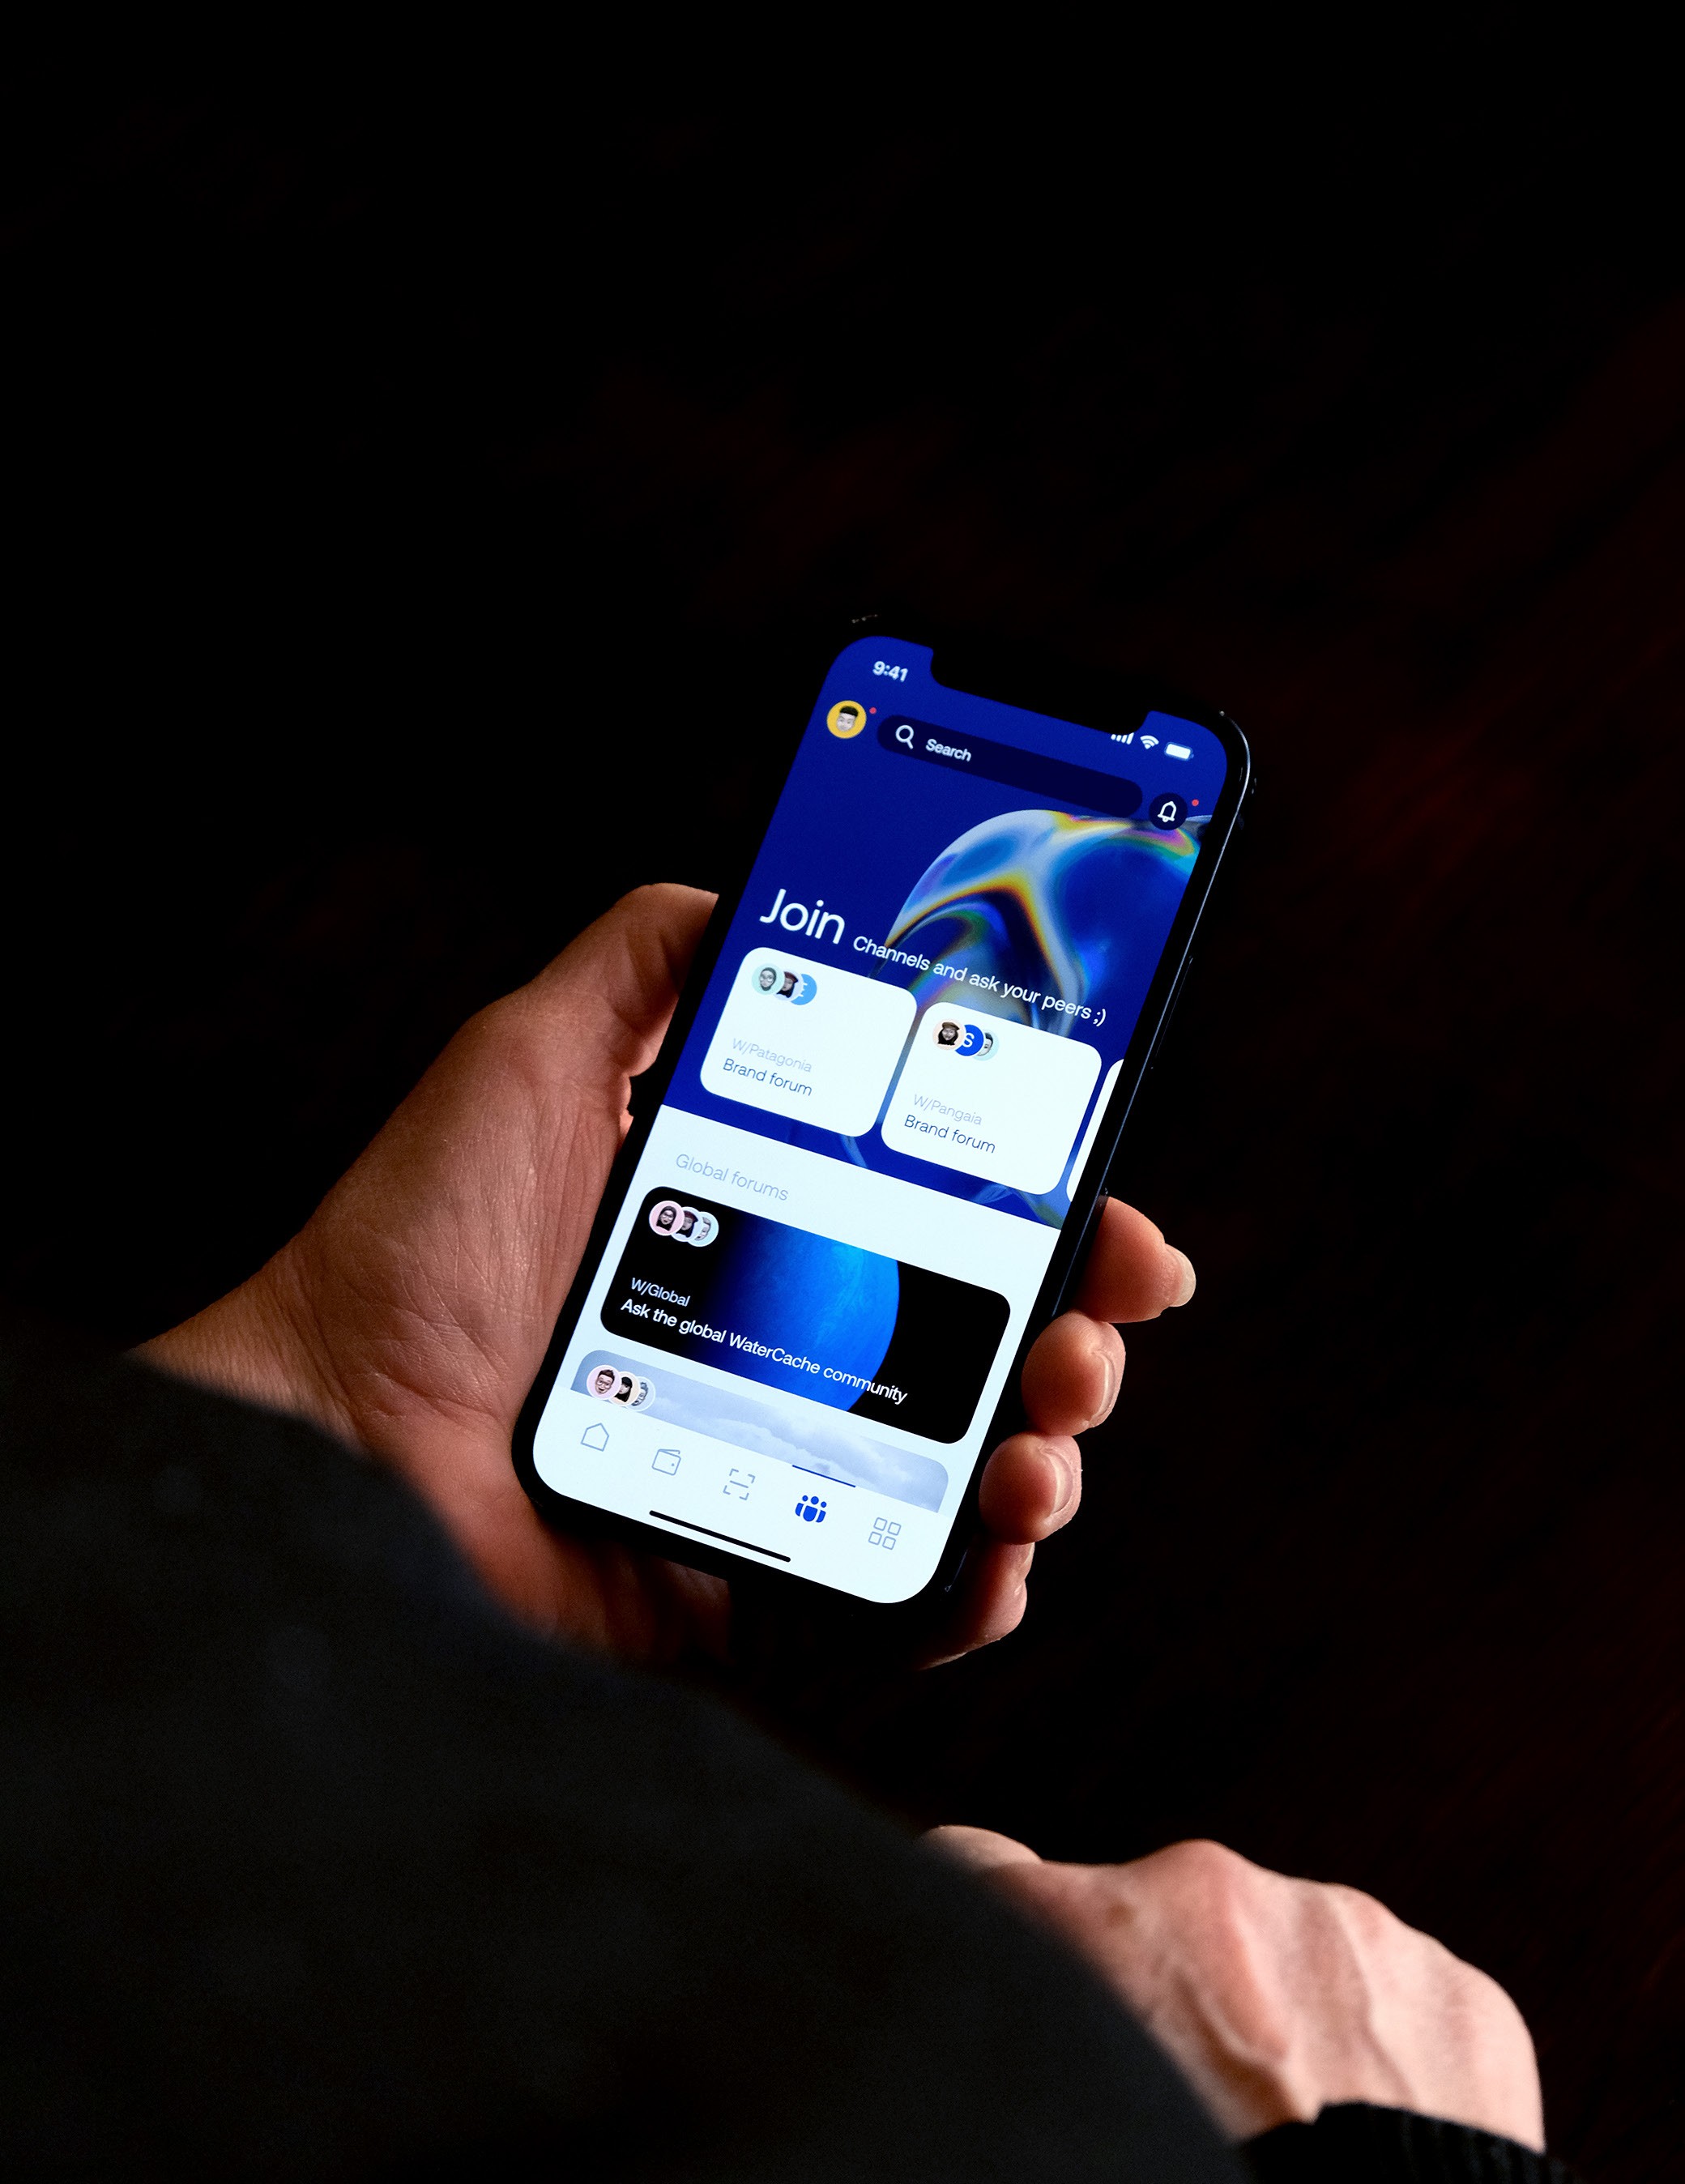
The Information Architecture was designed to create a seamless and intuitive navigation experience within the WaterCache app. It organizes content around the user's journey—from understanding their water footprint to discovering more sustainable choices. Key sections include the homepage dashboard, product scanning, personal wallet, community features, and a marketplace. The structure was built to minimize cognitive load and ensure that users could easily access the most relevant data at each step.
The Information Architecture was designed to create a seamless and intuitive navigation experience within the WaterCache app. It organizes content around the user's journey—from understanding their water footprint to discovering more sustainable choices. Key sections include the homepage dashboard, product scanning, personal wallet, community features, and a marketplace. The structure was built to minimize cognitive load and ensure that users could easily access the most relevant data at each step.

User Flows & User Testing
User Flows & User Testing
User Flows & User Testing
The Information Architecture was designed to create a seamless and intuitive navigation experience within the WaterCache app. It organizes content around the user's journey—from understanding their water footprint to discovering more sustainable choices. Key sections include the homepage dashboard, product scanning, personal wallet, community features, and a marketplace. The structure was built to minimize cognitive load and ensure that users could easily access the most relevant data at each step.
The Information Architecture was designed to create a seamless and intuitive navigation experience within the WaterCache app. It organizes content around the user's journey—from understanding their water footprint to discovering more sustainable choices. Key sections include the homepage dashboard, product scanning, personal wallet, community features, and a marketplace. The structure was built to minimize cognitive load and ensure that users could easily access the most relevant data at each step.